METOLIUSYP


Location

lon / lat [deg]: -121.56 / 44.43

Source network: EOS_LAND


Geostationary surface albedo (GSA) data


“+000”


“+057/+063”


Landcover information (based on ESA CCI landcover data)


Landcover fractions @ 2km distance


Landcover fractions @ 20 km distance


Legend


Distance to open water bodies [km]:

6.69

Distance to urban areas [km]:

10.81


Radius: 1 km

Number of landcover classes:

1

Dominant landcover type:

70: Tree cover, needleleaved, evergreen, closed to open (>15%)

Fraction of dominant landcover type [%]:

100.0


Radius: 2 km

Number of landcover classes:

1

Dominant landcover type:

70: Tree cover, needleleaved, evergreen, closed to open (>15%)

Fraction of dominant landcover type [%]:

100.0


Radius: 5 km

Number of landcover classes:

1

Dominant landcover type:

70: Tree cover, needleleaved, evergreen, closed to open (>15%)

Fraction of dominant landcover type [%]:

100.0


Radius: 10 km

Number of landcover classes:

3

Dominant landcover type:

70: Tree cover, needleleaved, evergreen, closed to open (>15%)

Fraction of dominant landcover type [%]:

94.0


Radius: 20 km

Number of landcover classes:

4

Dominant landcover type:

70: Tree cover, needleleaved, evergreen, closed to open (>15%)

Fraction of dominant landcover type [%]:

71.0


Disturbances


Heterogeneity analysis

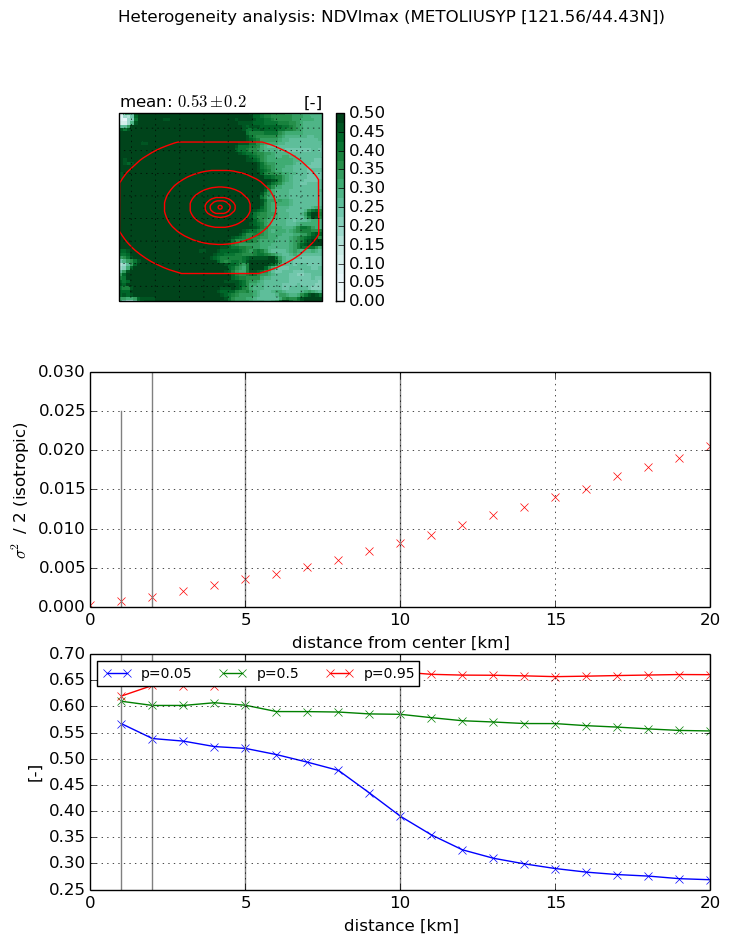
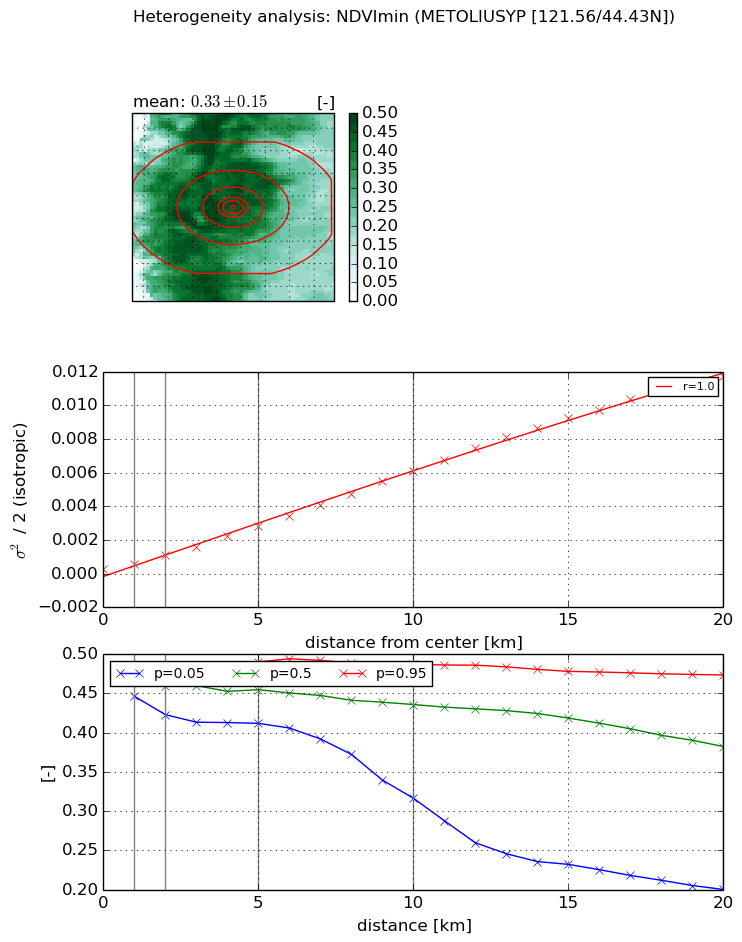
The heterogeneity analysis provides information about the spatial and temporal heterogeneity of the site.

Topography


Roman et al. (2009) index


St

6.96837369304

Rcv

0.152733131863

Rse

0.0

Rst

-0.000657254080947

Rsv

0.277126135148


Height range @ 1km [m]

123

Height range @ 2km [m]

227

Height range @ 5km [m]

284

Height range @ 10km [m]

-999

Height range @ 20km [m]

-999


Variance slope @ 1 km

2383

Variance slope @ 2 km

2987

Variance slope @ 5 km

2360

Variance slope @ 10 km

-999

Variance slope @ 20 km

-999


NDVI (max. NDVI composite)


Roman et al. (2009) index


St

4.83256656967e-06

Rcv

0.113439295296

Rse

0.0

Rst

0.120478703716

Rsv

620787.903556


NDVI range @ 1km [-]

0.05

NDVI range @ 2km [-]

0.1

NDVI range @ 5km [-]

0.13

NDVI range @ 10km [-]

0.28

NDVI range @ 20km [-]

0.39


Variance slope @ 1 km

0.000400485214367

Variance slope @ 2 km

0.000514687760376

Variance slope @ 5 km

0.000652788512114

Variance slope @ 10 km

0.000788708960601

Variance slope @ 20 km

0.00102986522935


NDVI (min. NDVI composite)I


Roman et al. (2009) index


St

8.89571019132e-07

Rcv

0.221105242271

Rse

0.0

Rst

0.0656938880724

Rsv

3372411.73594


NDVI range @ 1km [-]

0.03

NDVI range @ 2km [-]

0.06

NDVI range @ 5km [-]

0.08

NDVI range @ 10km [-]

0.17

NDVI range @ 20km [-]

0.27


NDVI slope @ 1 km

0.000316203303565

NDVI slope @ 2 km

0.00041187989948

NDVI slope @ 5 km

0.000521824769897

NDVI slope @ 10 km

0.000601655817085

NDVI slope @ 20 km

0.000607803220134


Temporal stability analysis

+000 deg (BHR)


BHR statistics

Temporal stability [1/decade]:


abs

rel


Weighted least square:

None


Ordinary least square:

None


Probabilities that GCOS criteria is met:

Weighted least square:

None %

Ordinary least square:

None %


DHR statistics

Temporal stability [1/decade]:


abs

rel


Weighted least square:

None


Ordinary least square:

None


Probabilities that GCOS criteria is met:

Weighted least square:

None %

Ordinary least square:

None %


+057/+063 deg (BHR)


BHR statistics

Temporal stability [1/decade]:


abs

rel


Weighted least square:

None


Ordinary least square:

None


Probabilities that GCOS criteria is met:

Weighted least square:

None %

Ordinary least square:

None %


DHR statistics

Temporal stability [1/decade]:


abs

rel


Weighted least square:

None


Ordinary least square:

None


Probabilities that GCOS criteria is met:

Weighted least square:

None %

Ordinary least square:

None %


Temporal anomaly analyis

The variance of the temporal anomalies provides an additional measure about the stability of the signal AFTER removal of the mean seasonal cylce.

+000 deg


+057/+063 deg