MEXICO_CITY


Location

lon / lat [deg]: -99.1817 / 19.3336

Source network: AERONET


Geostationary surface albedo (GSA) data


“+000”


“+057/+063”


Landcover information (based on ESA CCI landcover data)


Landcover fractions @ 2km distance


Landcover fractions @ 20 km distance


Legend


Distance to open water bodies [km]:

9.48

Distance to urban areas [km]:

0.13


Radius: 1 km

Number of landcover classes:

1

Dominant landcover type:

190: urban areas

Fraction of dominant landcover type [%]:

100.0


Radius: 2 km

Number of landcover classes:

1

Dominant landcover type:

190: urban areas

Fraction of dominant landcover type [%]:

100.0


Radius: 5 km

Number of landcover classes:

1

Dominant landcover type:

190: urban areas

Fraction of dominant landcover type [%]:

100.0


Radius: 10 km

Number of landcover classes:

2

Dominant landcover type:

190: urban areas

Fraction of dominant landcover type [%]:

93.0


Radius: 20 km

Number of landcover classes:

5

Dominant landcover type:

190: urban areas

Fraction of dominant landcover type [%]:

61.0


Disturbances


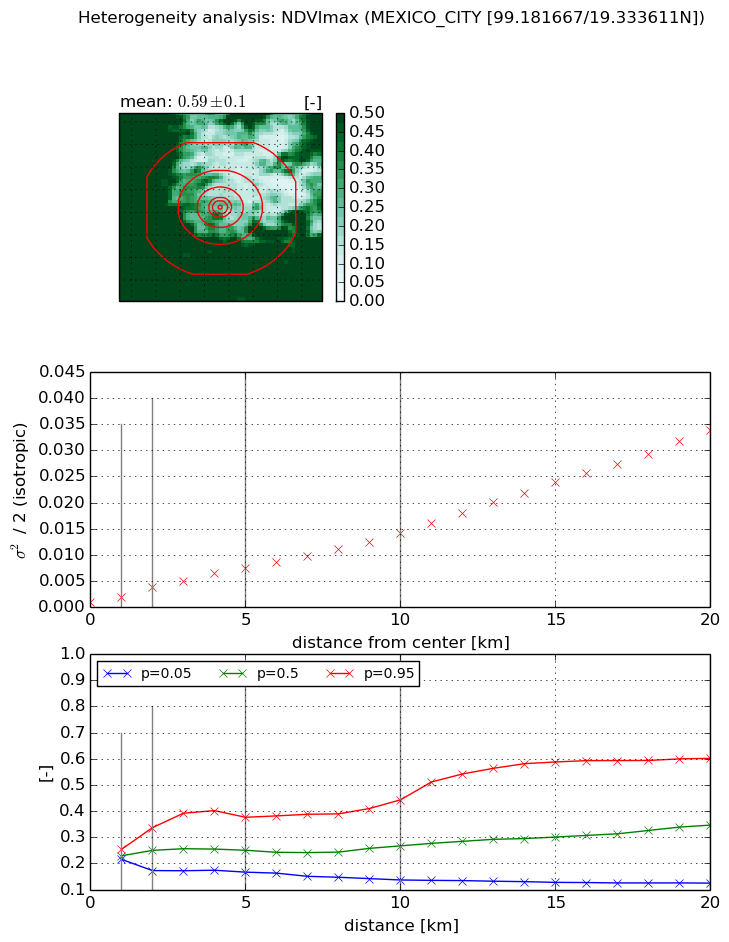
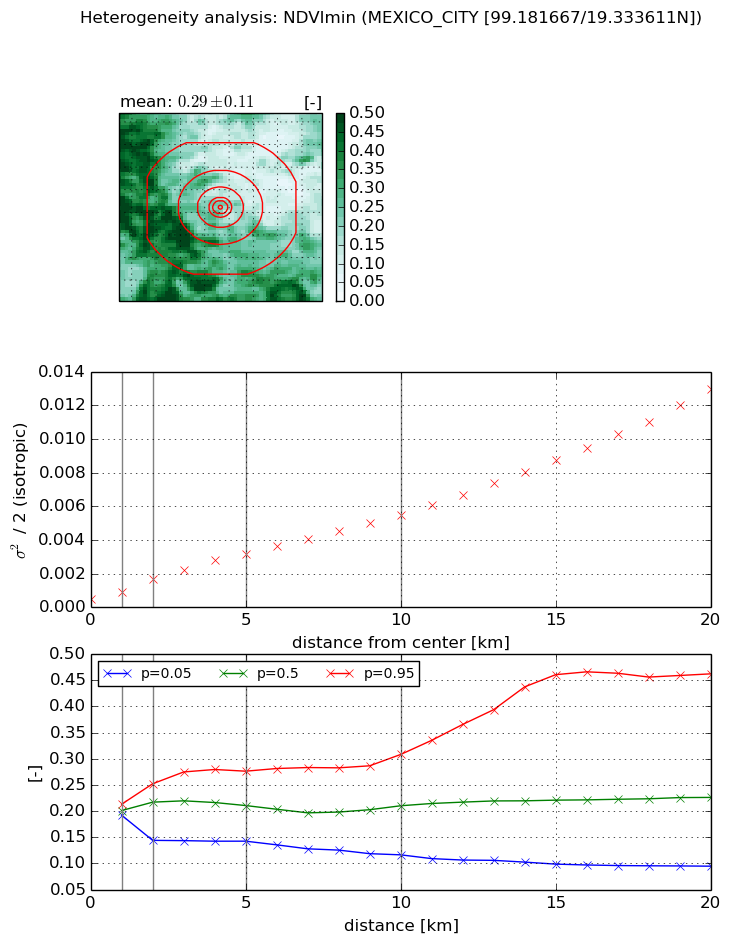
Heterogeneity analysis

The heterogeneity analysis provides information about the spatial and temporal heterogeneity of the site.

Topography


Roman et al. (2009) index


St

0.0703686255197

Rcv

0.778347619578

Rse

0.0

Rst

2.2383342503e-06

Rsv

41.8542861762


Height range @ 1km [m]

28

Height range @ 2km [m]

63

Height range @ 5km [m]

161

Height range @ 10km [m]

-999

Height range @ 20km [m]

-999


Variance slope @ 1 km

290

Variance slope @ 2 km

404

Variance slope @ 5 km

694

Variance slope @ 10 km

-999

Variance slope @ 20 km

-999


NDVI (max. NDVI composite)


Roman et al. (2009) index


St

1.2796003094

Rcv

0.0852240495546

Rse

0.0

Rst

-0.416589365086

Rsv

1.84266866931


NDVI range @ 1km [-]

0.04

NDVI range @ 2km [-]

0.16

NDVI range @ 5km [-]

0.21

NDVI range @ 10km [-]

0.31

NDVI range @ 20km [-]

0.48


Variance slope @ 1 km

0.000957363344646

Variance slope @ 2 km

0.00136230966973

Variance slope @ 5 km

0.00135556102517

Variance slope @ 10 km

0.00128230296164

Variance slope @ 20 km

0.00163055079481


NDVI (min. NDVI composite)I


Roman et al. (2009) index


St

2.36571737254

Rcv

0.135030785224

Rse

0.0

Rst

-0.373833508338

Rsv

0.759249993808


NDVI range @ 1km [-]

0.02

NDVI range @ 2km [-]

0.11

NDVI range @ 5km [-]

0.13

NDVI range @ 10km [-]

0.19

NDVI range @ 20km [-]

0.37


NDVI slope @ 1 km

0.000431496739784

NDVI slope @ 2 km

0.00060319216043

NDVI slope @ 5 km

0.000559536769088

NDVI slope @ 10 km

0.000495755287164

NDVI slope @ 20 km

0.000593589810248


Temporal stability analysis

+000 deg (BHR)


BHR statistics

Temporal stability [1/decade]:


abs

rel


Weighted least square:

None


Ordinary least square:

None


Probabilities that GCOS criteria is met:

Weighted least square:

None %

Ordinary least square:

None %


DHR statistics

Temporal stability [1/decade]:


abs

rel


Weighted least square:

None


Ordinary least square:

None


Probabilities that GCOS criteria is met:

Weighted least square:

None %

Ordinary least square:

None %


+057/+063 deg (BHR)


BHR statistics

Temporal stability [1/decade]:


abs

rel


Weighted least square:

None


Ordinary least square:

None


Probabilities that GCOS criteria is met:

Weighted least square:

None %

Ordinary least square:

None %


DHR statistics

Temporal stability [1/decade]:


abs

rel


Weighted least square:

None


Ordinary least square:

None


Probabilities that GCOS criteria is met:

Weighted least square:

None %

Ordinary least square:

None %


Temporal anomaly analyis

The variance of the temporal anomalies provides an additional measure about the stability of the signal AFTER removal of the mean seasonal cylce.

+000 deg


+057/+063 deg