MFUWE


Location

lon / lat [deg]: 31.9308 / -13.2567

Source network: AERONET


Geostationary surface albedo (GSA) data


“+000”


“+057/+063”


Landcover information (based on ESA CCI landcover data)


Landcover fractions @ 2km distance


Landcover fractions @ 20 km distance


Legend


Distance to open water bodies [km]:

21.74

Distance to urban areas [km]:

none in region


Radius: 1 km

Number of landcover classes:

4

Dominant landcover type:

10: cropland, rainfed

Fraction of dominant landcover type [%]:

56.0


Radius: 2 km

Number of landcover classes:

7

Dominant landcover type:

10: cropland, rainfed

Fraction of dominant landcover type [%]:

54.0


Radius: 5 km

Number of landcover classes:

5

Dominant landcover type:

10: cropland, rainfed

Fraction of dominant landcover type [%]:

37.0


Radius: 10 km

Number of landcover classes:

5

Dominant landcover type:

62: Tree cover, broadleaved, decidous (open 15-40%)

Fraction of dominant landcover type [%]:

33.0


Radius: 20 km

Number of landcover classes:

5

Dominant landcover type:

120: Shrubland

Fraction of dominant landcover type [%]:

39.0


Disturbances


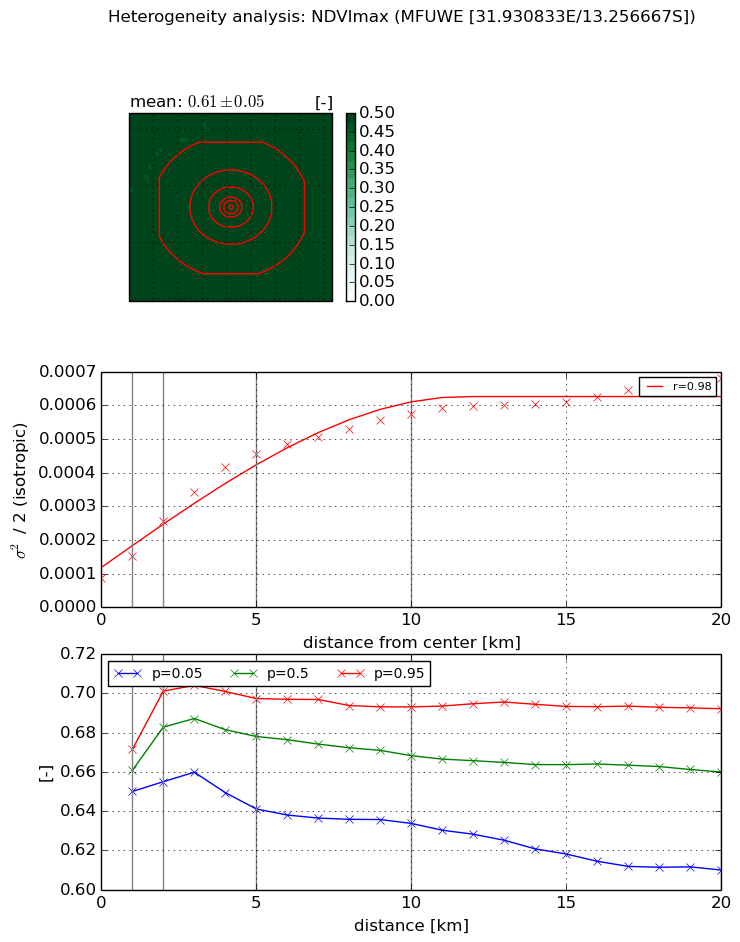
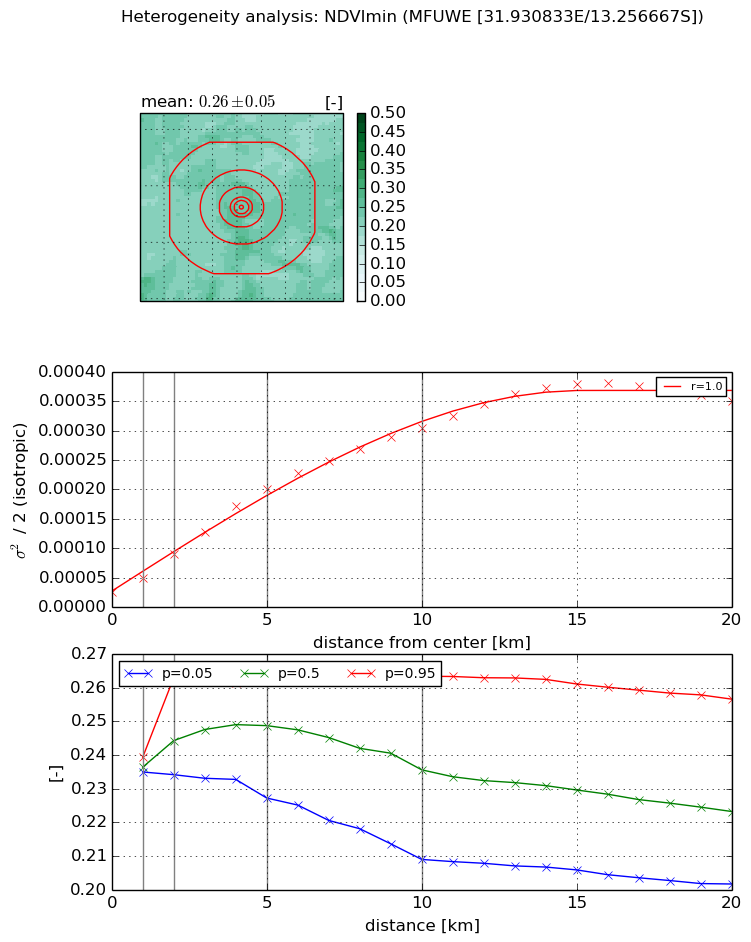
Heterogeneity analysis

The heterogeneity analysis provides information about the spatial and temporal heterogeneity of the site.

Topography


Roman et al. (2009) index


St

2.49760270015

Rcv

0.188071233489

Rse

0.0

Rst

-0.0130812216702

Rsv

-0.999999353261


Height range @ 1km [m]

10

Height range @ 2km [m]

11

Height range @ 5km [m]

16

Height range @ 10km [m]

-999

Height range @ 20km [m]

-999


Variance slope @ 1 km

4

Variance slope @ 2 km

4

Variance slope @ 5 km

4

Variance slope @ 10 km

-999

Variance slope @ 20 km

-999


NDVI (max. NDVI composite)


Roman et al. (2009) index


St

0.610074731006

Rcv

0.345804113383

Rse

0.0

Rst

-0.738725895731

Rsv

3.83290034414


NDVI range @ 1km [-]

0.02

NDVI range @ 2km [-]

0.05

NDVI range @ 5km [-]

0.06

NDVI range @ 10km [-]

0.06

NDVI range @ 20km [-]

0.08


Variance slope @ 1 km

6.59380827707e-05

Variance slope @ 2 km

8.57574053073e-05

Variance slope @ 5 km

7.82388866148e-05

Variance slope @ 10 km

4.7987831151e-05

Variance slope @ 20 km

2.46608826392e-05


NDVI (min. NDVI composite)I


Roman et al. (2009) index


St

11.4400362426

Rcv

0.182448457944

Rse

0.0

Rst

-0.0212763707101

Rsv

-0.0585121028


NDVI range @ 1km [-]

0.0

NDVI range @ 2km [-]

0.03

NDVI range @ 5km [-]

0.03

NDVI range @ 10km [-]

0.05

NDVI range @ 20km [-]

0.05


NDVI slope @ 1 km

2.37145199803e-05

NDVI slope @ 2 km

3.22852111825e-05

NDVI slope @ 5 km

3.65059146179e-05

NDVI slope @ 10 km

2.89368011072e-05

NDVI slope @ 20 km

1.71643308817e-05


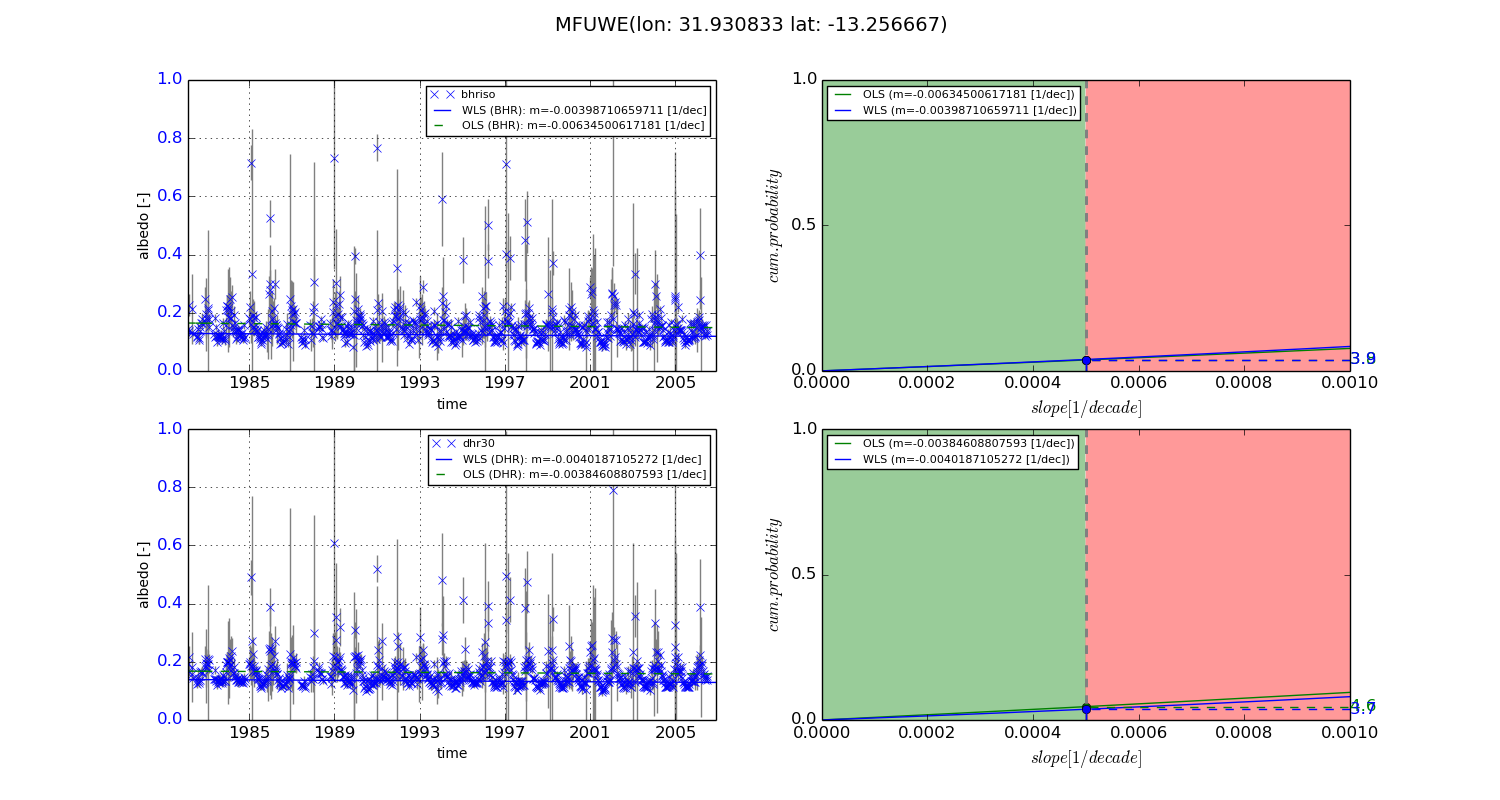
Temporal stability analysis

+000 deg (BHR)


BHR statistics

Temporal stability [1/decade]:


abs

rel


Weighted least square:

-0.00398710659711


Ordinary least square:

-0.00634500617181


Probabilities that GCOS criteria is met:

Weighted least square:

3.9 %

Ordinary least square:

3.8 %


DHR statistics

Temporal stability [1/decade]:


abs

rel


Weighted least square:

-0.0040187105272


Ordinary least square:

-0.00384608807593


Probabilities that GCOS criteria is met:

Weighted least square:

3.7 %

Ordinary least square:

4.6 %


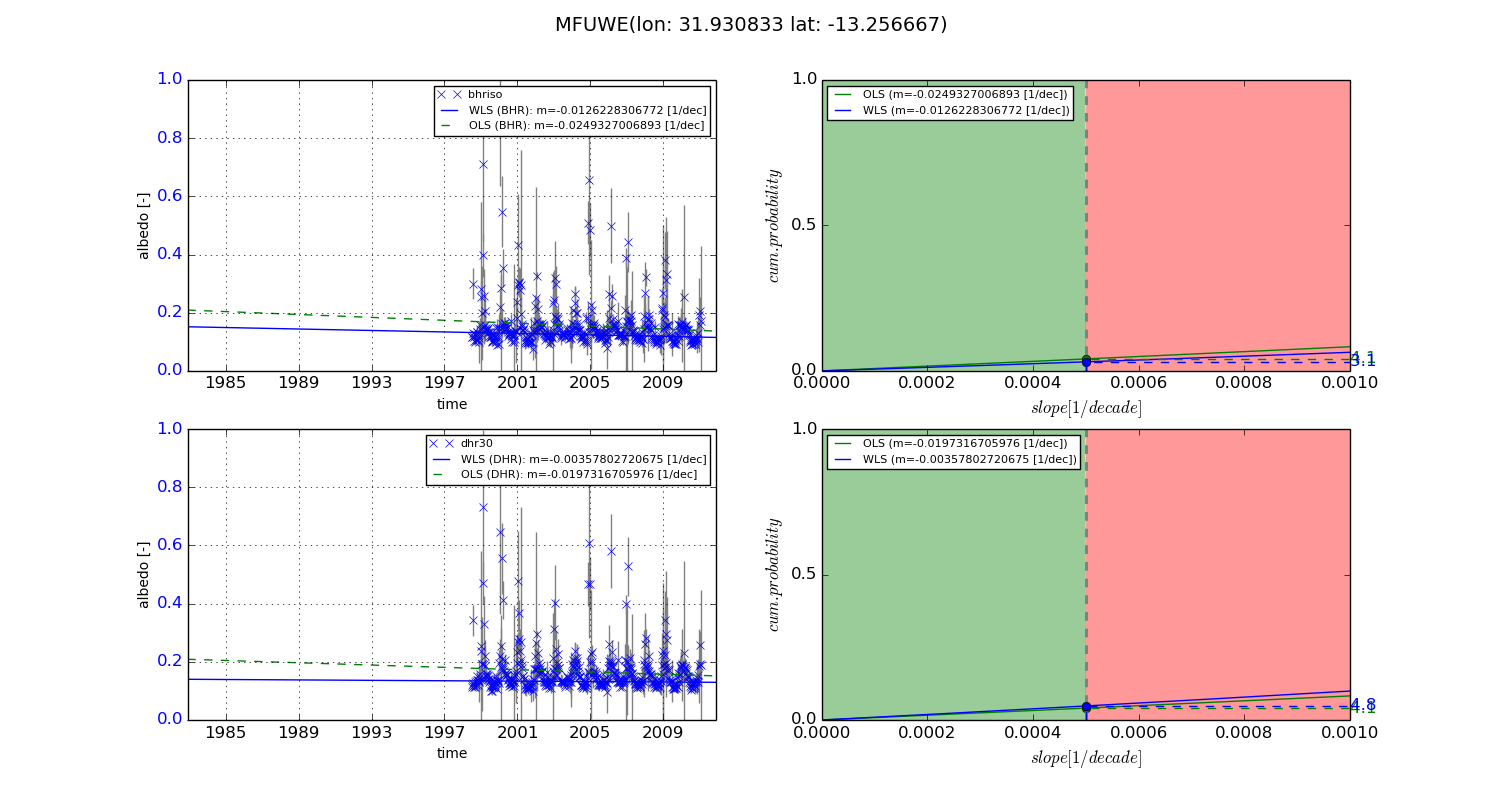
+057/+063 deg (BHR)


BHR statistics

Temporal stability [1/decade]:


abs

rel


Weighted least square:

-0.0126228306772


Ordinary least square:

-0.0249327006893


Probabilities that GCOS criteria is met:

Weighted least square:

3.1 %

Ordinary least square:

4.1 %


DHR statistics

Temporal stability [1/decade]:


abs

rel


Weighted least square:

-0.00357802720675


Ordinary least square:

-0.0197316705976


Probabilities that GCOS criteria is met:

Weighted least square:

4.8 %

Ordinary least square:

4.1 %


Temporal anomaly analyis

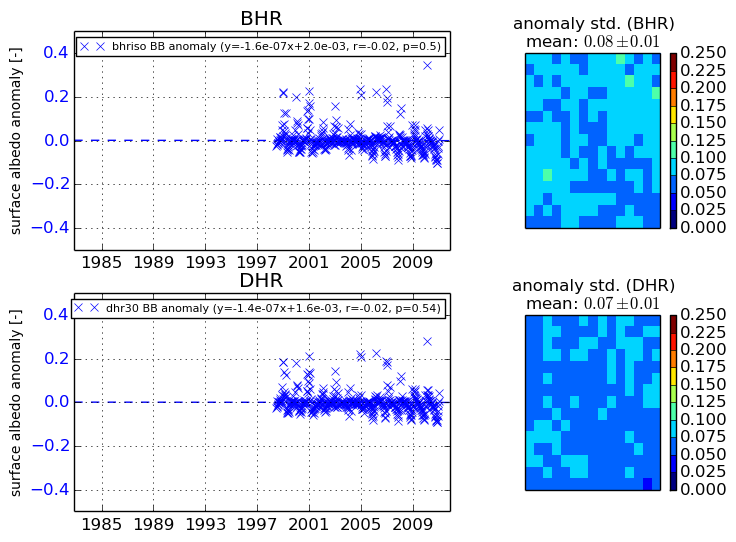
The variance of the temporal anomalies provides an additional measure about the stability of the signal AFTER removal of the mean seasonal cylce.
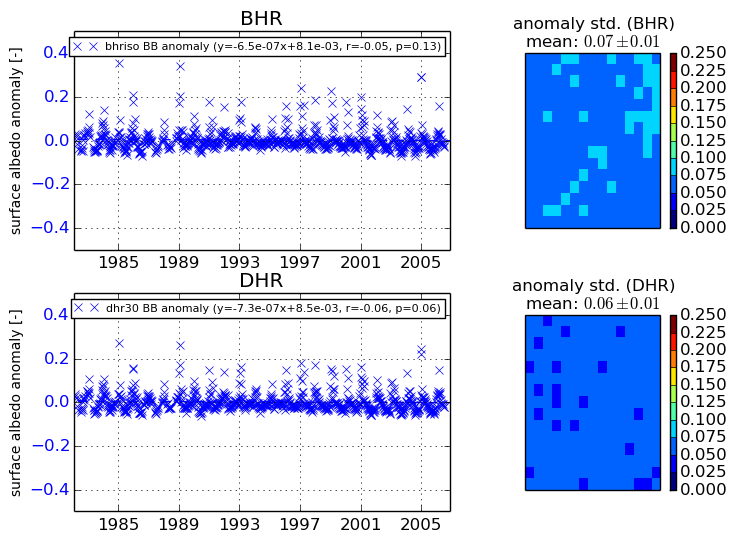
+000 deg


+057/+063 deg