MINQIN


Location

lon / lat [deg]: 102.959 / 38.607

Source network: AERONET


Geostationary surface albedo (GSA) data


“+000”


“+057/+063”


Landcover information (based on ESA CCI landcover data)


Landcover fractions @ 2km distance


Landcover fractions @ 20 km distance


Legend


Distance to open water bodies [km]:

22.12

Distance to urban areas [km]:

11.68


Radius: 1 km

Number of landcover classes:

2

Dominant landcover type:

130: grassland

Fraction of dominant landcover type [%]:

63.0


Radius: 2 km

Number of landcover classes:

4

Dominant landcover type:

130: grassland

Fraction of dominant landcover type [%]:

53.0


Radius: 5 km

Number of landcover classes:

4

Dominant landcover type:

130: grassland

Fraction of dominant landcover type [%]:

43.0


Radius: 10 km

Number of landcover classes:

5

Dominant landcover type:

20: cropland, irrigated or post-flooded

Fraction of dominant landcover type [%]:

36.0


Radius: 20 km

Number of landcover classes:

5

Dominant landcover type:

200: bare areas

Fraction of dominant landcover type [%]:

38.0


Disturbances


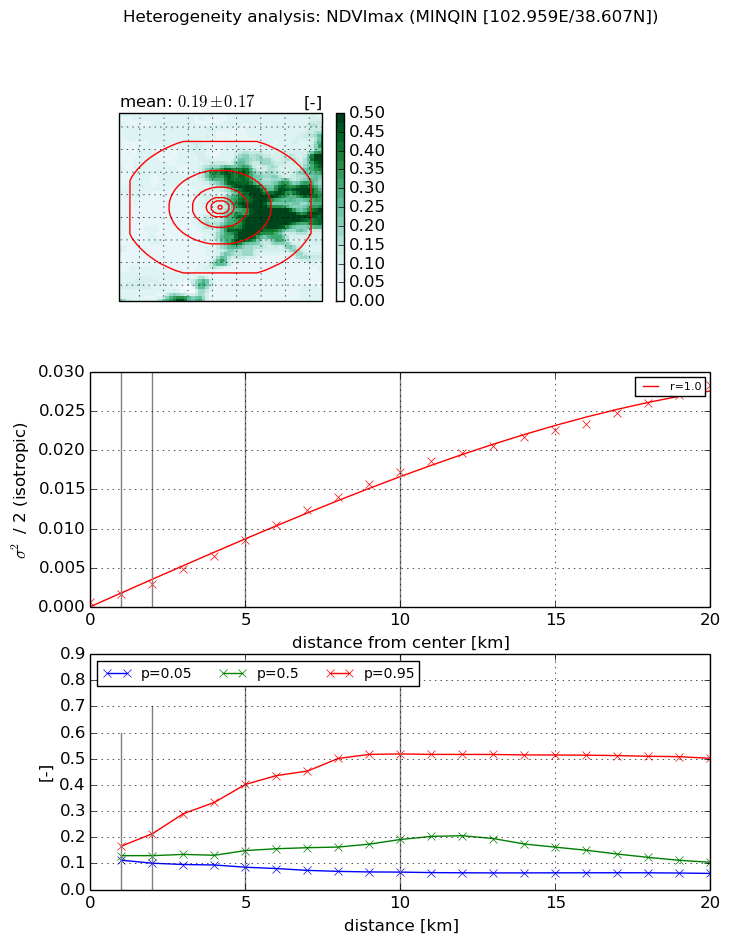
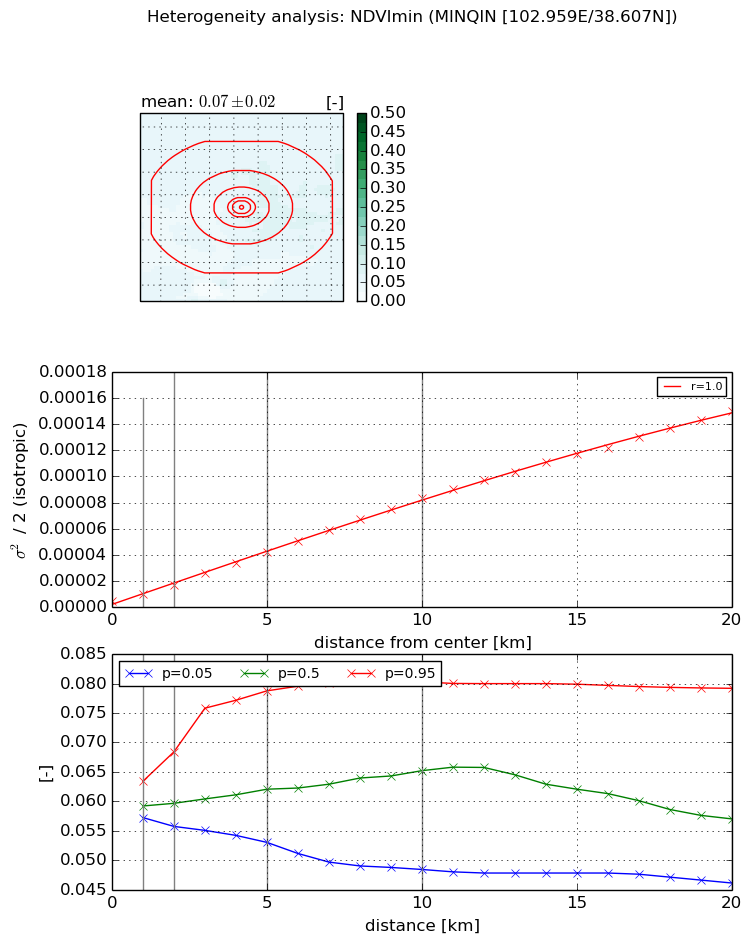
Heterogeneity analysis

The heterogeneity analysis provides information about the spatial and temporal heterogeneity of the site.

Topography


Roman et al. (2009) index


St

2.07946370983

Rcv

0.466896306177

Rse

0.0

Rst

-1.52440204737e-08

Rsv

-0.975783339597


Height range @ 1km [m]

5

Height range @ 2km [m]

6

Height range @ 5km [m]

10

Height range @ 10km [m]

-999

Height range @ 20km [m]

-999


Variance slope @ 1 km

1

Variance slope @ 2 km

1

Variance slope @ 5 km

2

Variance slope @ 10 km

-999

Variance slope @ 20 km

-999


NDVI (max. NDVI composite)


Roman et al. (2009) index


St

3.92207875657

Rcv

0.336159443973

Rse

0.0

Rst

-2.40620275803e-09

Rsv

0.428741053126


NDVI range @ 1km [-]

0.05

NDVI range @ 2km [-]

0.11

NDVI range @ 5km [-]

0.32

NDVI range @ 10km [-]

0.45

NDVI range @ 20km [-]

0.44


Variance slope @ 1 km

0.000928604791764

Variance slope @ 2 km

0.00110631741225

Variance slope @ 5 km

0.001599017955

Variance slope @ 10 km

0.00173609018178

Variance slope @ 20 km

0.00140740258014


NDVI (min. NDVI composite)I


Roman et al. (2009) index


St

0.270010082547

Rcv

0.282018592448

Rse

0.0

Rst

9.96996796416e-08

Rsv

10.8286775148


NDVI range @ 1km [-]

0.01

NDVI range @ 2km [-]

0.01

NDVI range @ 5km [-]

0.03

NDVI range @ 10km [-]

0.03

NDVI range @ 20km [-]

0.03


NDVI slope @ 1 km

5.53498622167e-06

NDVI slope @ 2 km

6.10777216286e-06

NDVI slope @ 5 km

7.71326145349e-06

NDVI slope @ 10 km

8.09867694876e-06

NDVI slope @ 20 km

7.40150992753e-06


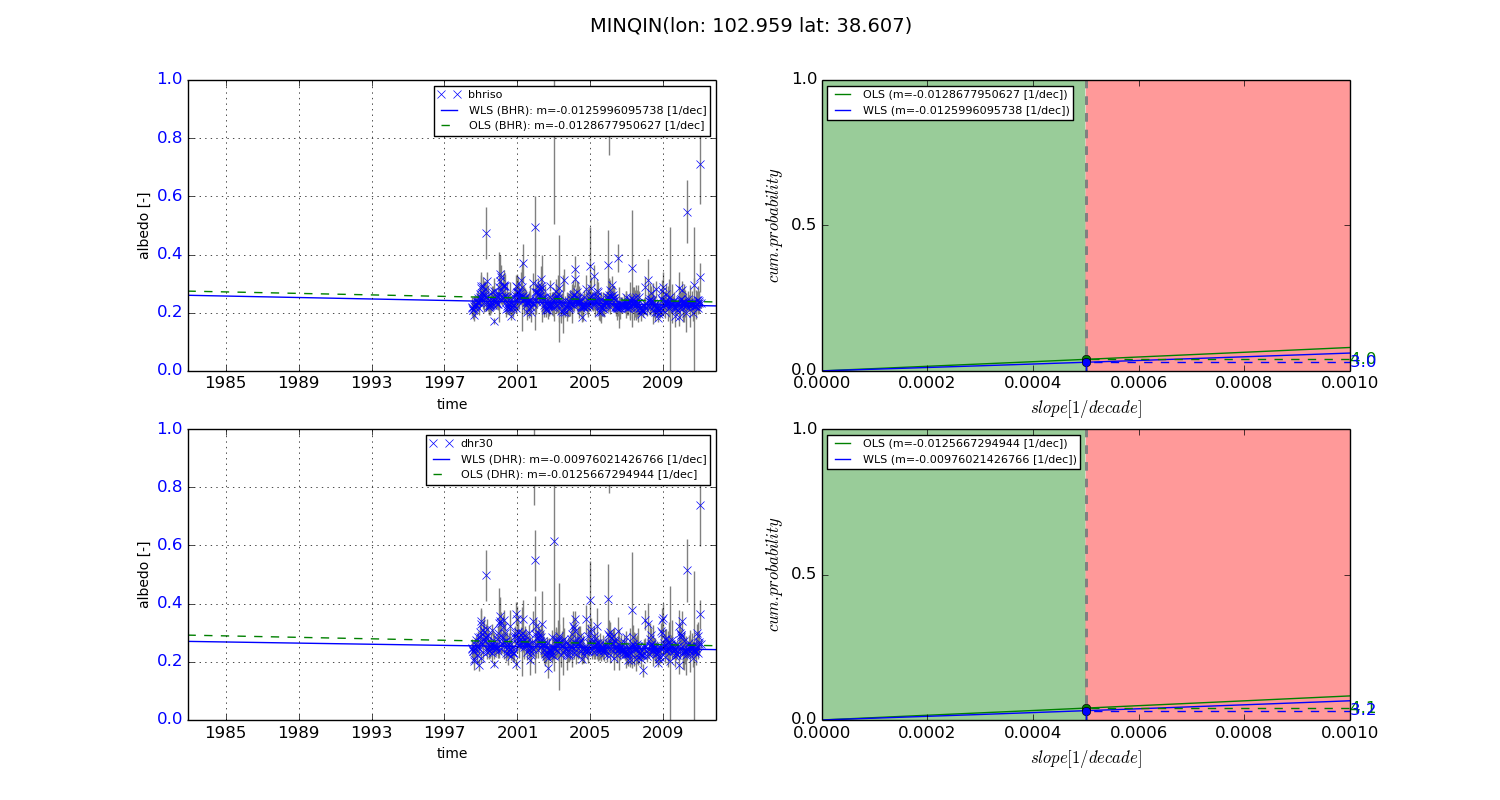
Temporal stability analysis

+000 deg (BHR)


BHR statistics

Temporal stability [1/decade]:


abs

rel


Weighted least square:

None


Ordinary least square:

None


Probabilities that GCOS criteria is met:

Weighted least square:

None %

Ordinary least square:

None %


DHR statistics

Temporal stability [1/decade]:


abs

rel


Weighted least square:

None


Ordinary least square:

None


Probabilities that GCOS criteria is met:

Weighted least square:

None %

Ordinary least square:

None %


+057/+063 deg (BHR)


BHR statistics

Temporal stability [1/decade]:


abs

rel


Weighted least square:

-0.0125996095738


Ordinary least square:

-0.0128677950627


Probabilities that GCOS criteria is met:

Weighted least square:

3.0 %

Ordinary least square:

4.0 %


DHR statistics

Temporal stability [1/decade]:


abs

rel


Weighted least square:

-0.00976021426766


Ordinary least square:

-0.0125667294944


Probabilities that GCOS criteria is met:

Weighted least square:

3.2 %

Ordinary least square:

4.1 %


Temporal anomaly analyis

The variance of the temporal anomalies provides an additional measure about the stability of the signal AFTER removal of the mean seasonal cylce.

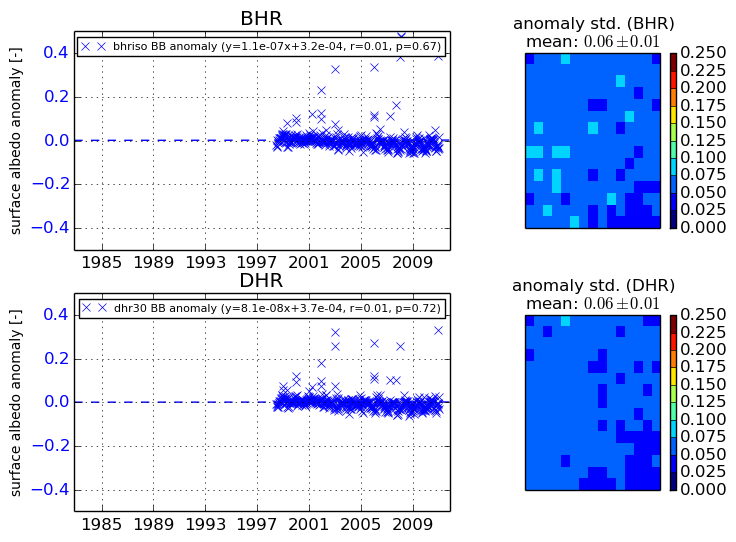
+000 deg


+057/+063 deg