MINSK


Location

lon / lat [deg]: 27.601 / 53.92

Source network: AERONET


Geostationary surface albedo (GSA) data


“+000”


“+057/+063”


Landcover information (based on ESA CCI landcover data)


Landcover fractions @ 2km distance


Landcover fractions @ 20 km distance


Legend


Distance to open water bodies [km]:

3.19

Distance to urban areas [km]:

0.1


Radius: 1 km

Number of landcover classes:

1

Dominant landcover type:

190: urban areas

Fraction of dominant landcover type [%]:

100.0


Radius: 2 km

Number of landcover classes:

1

Dominant landcover type:

190: urban areas

Fraction of dominant landcover type [%]:

100.0


Radius: 5 km

Number of landcover classes:

4

Dominant landcover type:

190: urban areas

Fraction of dominant landcover type [%]:

91.0


Radius: 10 km

Number of landcover classes:

5

Dominant landcover type:

190: urban areas

Fraction of dominant landcover type [%]:

60.0


Radius: 20 km

Number of landcover classes:

6

Dominant landcover type:

10: cropland, rainfed

Fraction of dominant landcover type [%]:

53.0


Disturbances


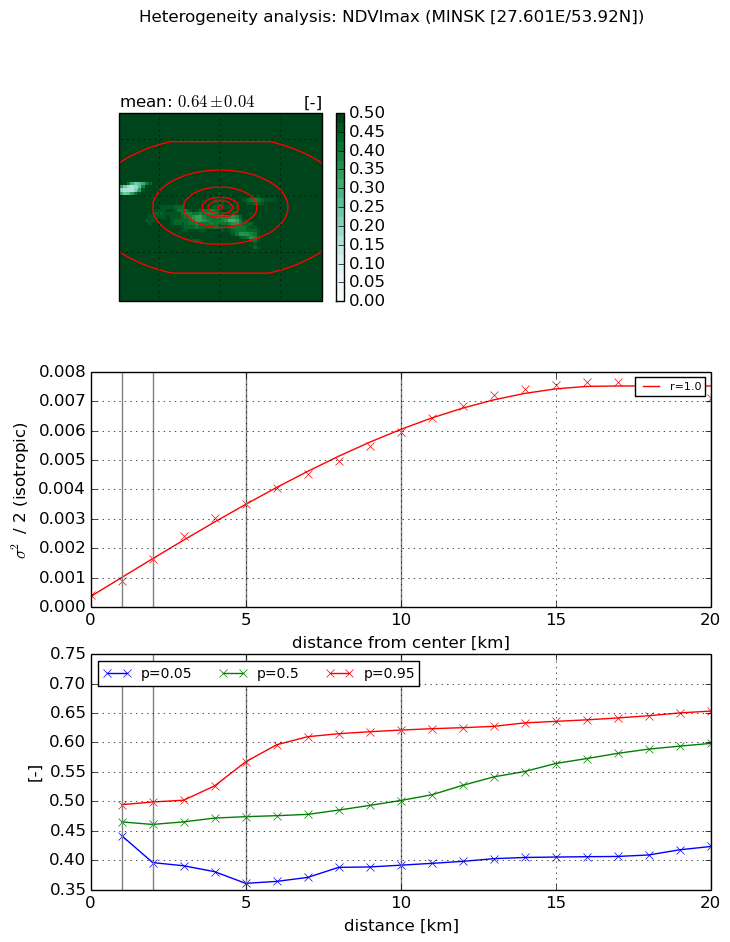
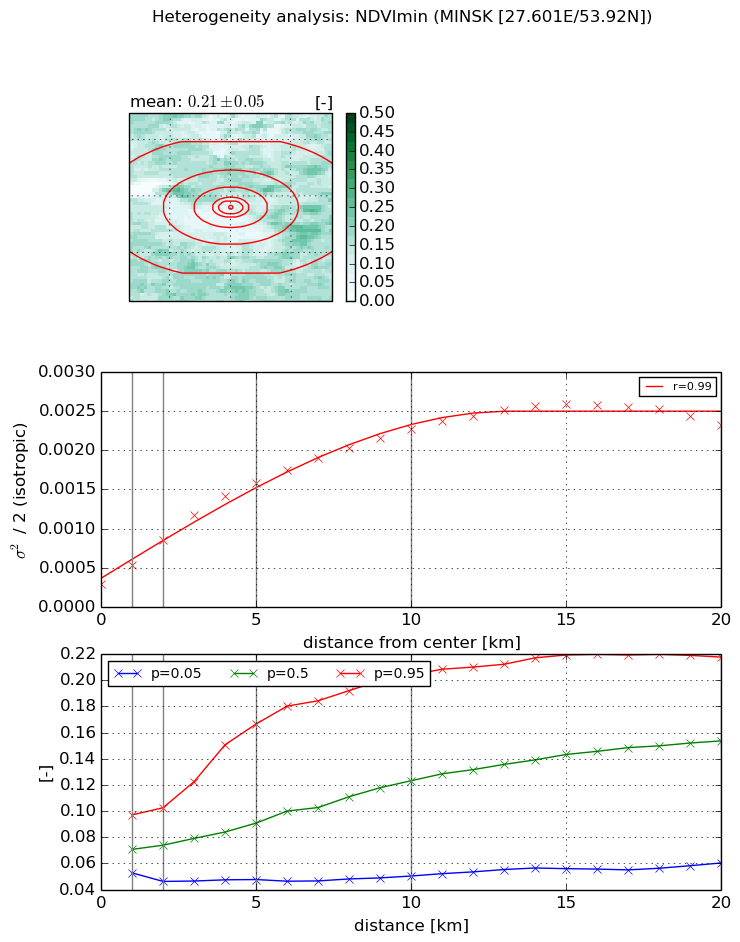
Heterogeneity analysis

The heterogeneity analysis provides information about the spatial and temporal heterogeneity of the site.

Topography


Roman et al. (2009) index


St

4.51181715062

Rcv

0.220353154428

Rse

0.0

Rst

-0.032527634657

Rsv

-0.412039773928


Height range @ 1km [m]

21

Height range @ 2km [m]

28

Height range @ 5km [m]

39

Height range @ 10km [m]

-999

Height range @ 20km [m]

-999


Variance slope @ 1 km

56

Variance slope @ 2 km

41

Variance slope @ 5 km

25

Variance slope @ 10 km

-999

Variance slope @ 20 km

-999


NDVI (max. NDVI composite)


Roman et al. (2009) index


St

1.79623274098

Rcv

0.59591543017

Rse

0.0

Rst

-0.074246824203

Rsv

-0.999999930932


NDVI range @ 1km [-]

0.05

NDVI range @ 2km [-]

0.1

NDVI range @ 5km [-]

0.21

NDVI range @ 10km [-]

0.23

NDVI range @ 20km [-]

0.23


Variance slope @ 1 km

0.000478751245131

Variance slope @ 2 km

0.000606779906538

Variance slope @ 5 km

0.000643018245215

Variance slope @ 10 km

0.000555567798296

Variance slope @ 20 km

0.000368508704171


NDVI (min. NDVI composite)I


Roman et al. (2009) index


St

2.55031054839

Rcv

0.297831838635

Rse

0.0

Rst

-0.0473444302188

Rsv

0.831151061908


NDVI range @ 1km [-]

0.04

NDVI range @ 2km [-]

0.06

NDVI range @ 5km [-]

0.12

NDVI range @ 10km [-]

0.15

NDVI range @ 20km [-]

0.16


NDVI slope @ 1 km

0.000240813169868

NDVI slope @ 2 km

0.00028381790442

NDVI slope @ 5 km

0.000268856551127

NDVI slope @ 10 km

0.000196990961062

NDVI slope @ 20 km

0.000101968948788


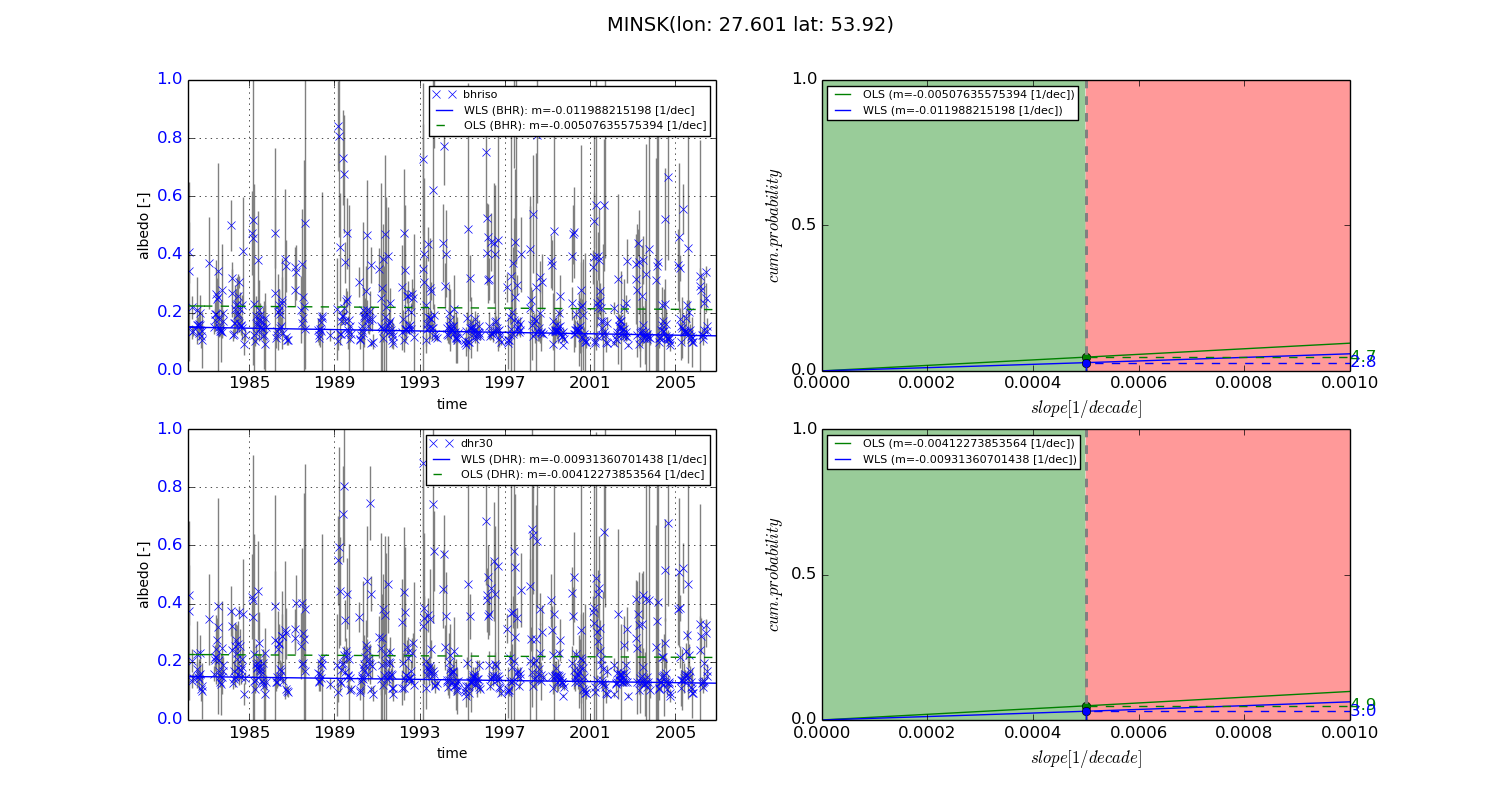
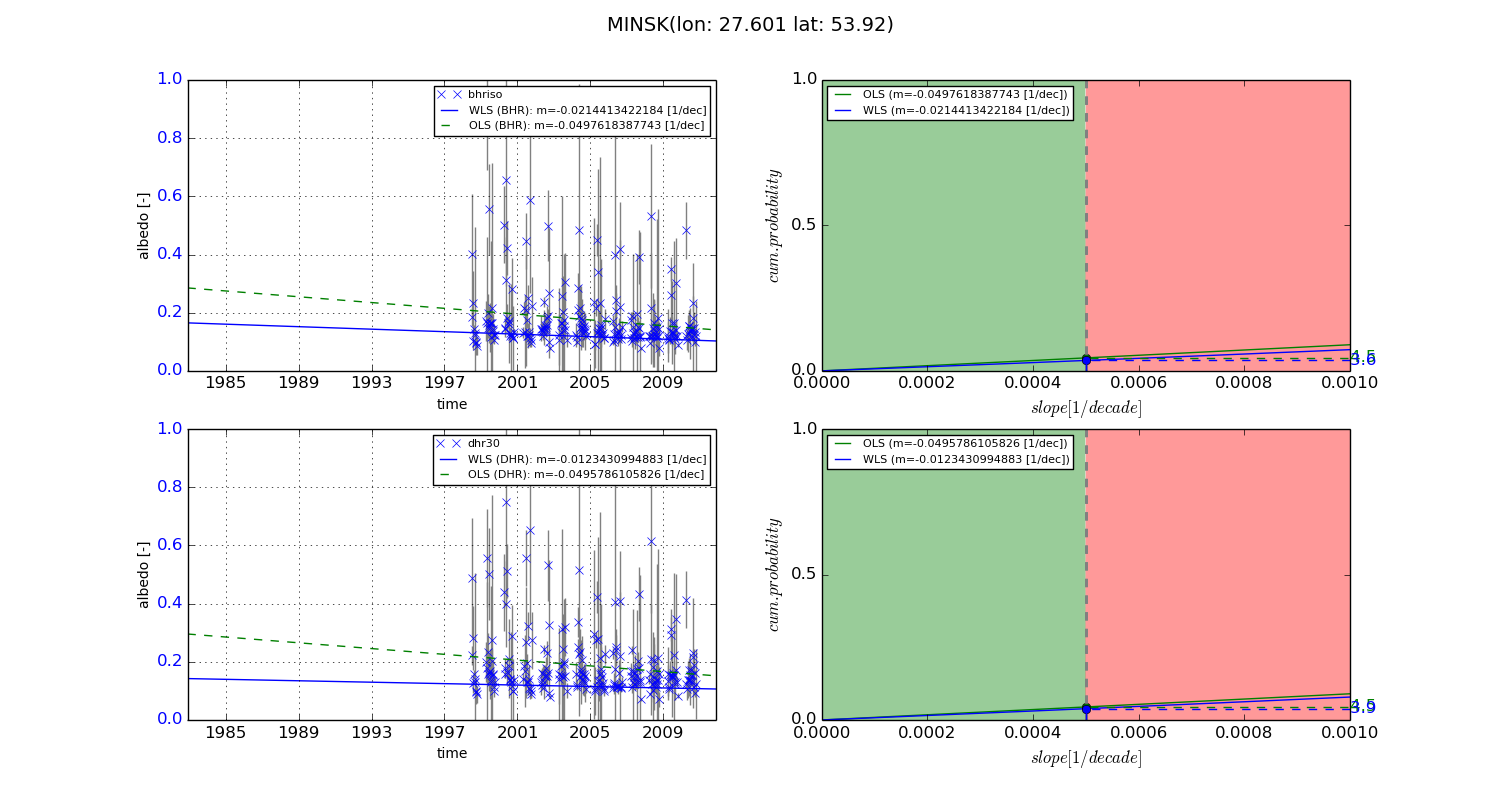
Temporal stability analysis

+000 deg (BHR)


BHR statistics

Temporal stability [1/decade]:


abs

rel


Weighted least square:

-0.011988215198


Ordinary least square:

-0.00507635575394


Probabilities that GCOS criteria is met:

Weighted least square:

2.8 %

Ordinary least square:

4.7 %


DHR statistics

Temporal stability [1/decade]:


abs

rel


Weighted least square:

-0.00931360701438


Ordinary least square:

-0.00412273853564


Probabilities that GCOS criteria is met:

Weighted least square:

3.0 %

Ordinary least square:

4.9 %


+057/+063 deg (BHR)


BHR statistics

Temporal stability [1/decade]:


abs

rel


Weighted least square:

-0.0214413422184


Ordinary least square:

-0.0497618387743


Probabilities that GCOS criteria is met:

Weighted least square:

3.6 %

Ordinary least square:

4.5 %


DHR statistics

Temporal stability [1/decade]:


abs

rel


Weighted least square:

-0.0123430994883


Ordinary least square:

-0.0495786105826


Probabilities that GCOS criteria is met:

Weighted least square:

3.9 %

Ordinary least square:

4.5 %


Temporal anomaly analyis

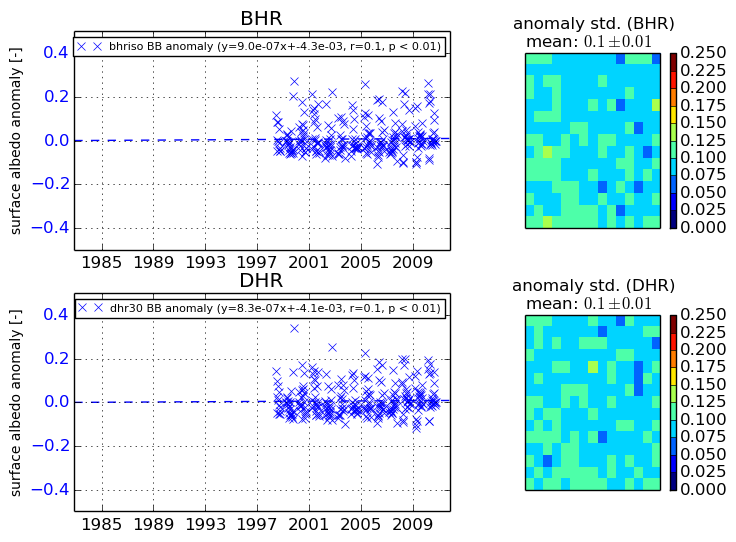
The variance of the temporal anomalies provides an additional measure about the stability of the signal AFTER removal of the mean seasonal cylce.
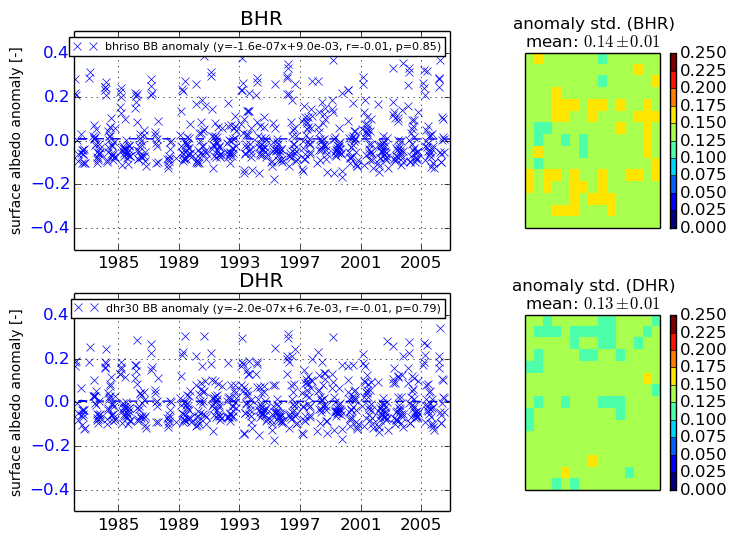
+000 deg


+057/+063 deg