MISSOULA


Location

lon / lat [deg]: -114.0833 / 46.9167

Source network: AERONET


Geostationary surface albedo (GSA) data


“+000”


“+057/+063”


Landcover information (based on ESA CCI landcover data)


Landcover fractions @ 2km distance


Landcover fractions @ 20 km distance


Legend


Distance to open water bodies [km]:

4.5

Distance to urban areas [km]:

0.19


Radius: 1 km

Number of landcover classes:

4

Dominant landcover type:

130: grassland

Fraction of dominant landcover type [%]:

71.0


Radius: 2 km

Number of landcover classes:

4

Dominant landcover type:

130: grassland

Fraction of dominant landcover type [%]:

74.0


Radius: 5 km

Number of landcover classes:

4

Dominant landcover type:

130: grassland

Fraction of dominant landcover type [%]:

84.0


Radius: 10 km

Number of landcover classes:

5

Dominant landcover type:

130: grassland

Fraction of dominant landcover type [%]:

61.0


Radius: 20 km

Number of landcover classes:

5

Dominant landcover type:

70: Tree cover, needleleaved, evergreen, closed to open (>15%)

Fraction of dominant landcover type [%]:

49.0


Disturbances


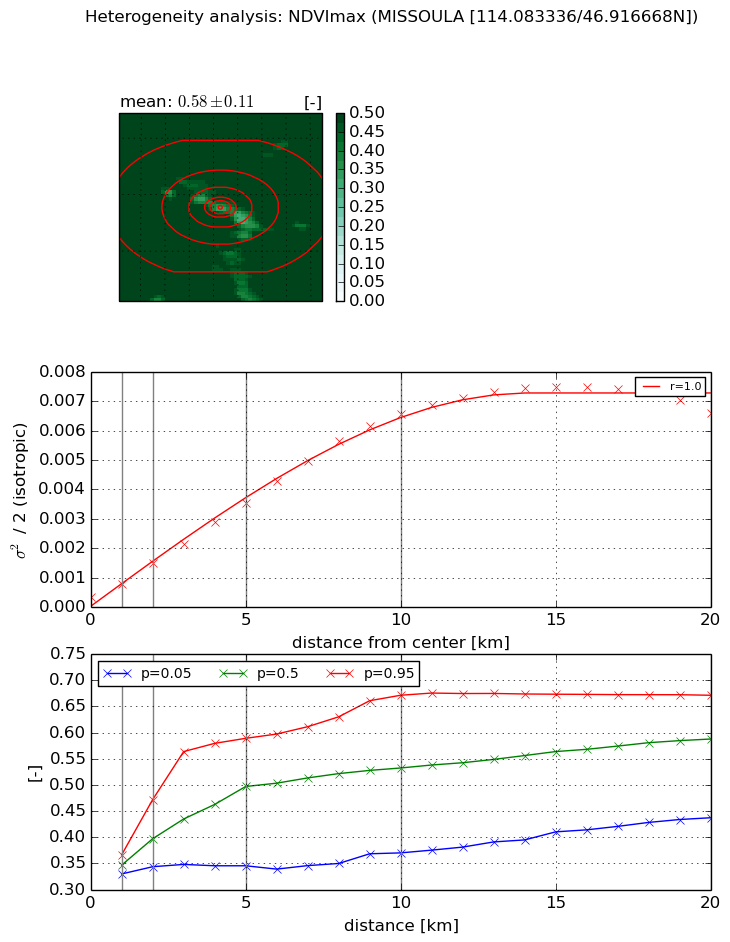
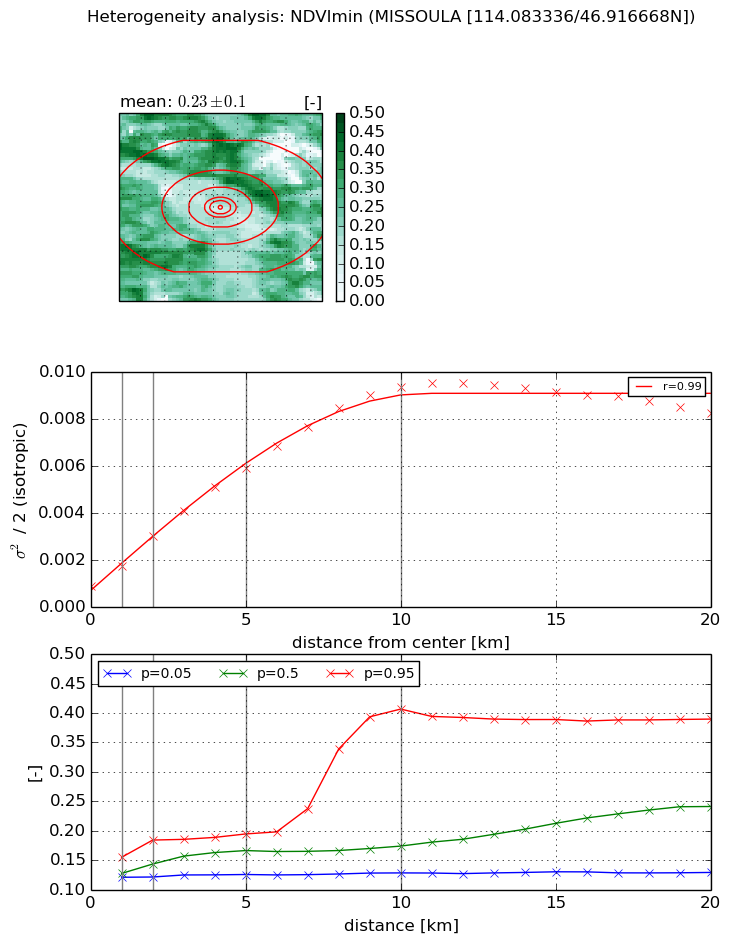
Heterogeneity analysis

The heterogeneity analysis provides information about the spatial and temporal heterogeneity of the site.

Topography


Roman et al. (2009) index


St

1.93469000168

Rcv

0.554092237501

Rse

0.0

Rst

-0.000153976462482

Rsv

-0.996389803899


Height range @ 1km [m]

8

Height range @ 2km [m]

63

Height range @ 5km [m]

244

Height range @ 10km [m]

-999

Height range @ 20km [m]

-999


Variance slope @ 1 km

912

Variance slope @ 2 km

1022

Variance slope @ 5 km

1201

Variance slope @ 10 km

-999

Variance slope @ 20 km

-999


NDVI (max. NDVI composite)


Roman et al. (2009) index


St

5.88041128028

Rcv

0.123712077131

Rse

0.0

Rst

-0.015793895797

Rsv

0.370662424657


NDVI range @ 1km [-]

0.04

NDVI range @ 2km [-]

0.13

NDVI range @ 5km [-]

0.24

NDVI range @ 10km [-]

0.3

NDVI range @ 20km [-]

0.23


Variance slope @ 1 km

0.000416523631188

Variance slope @ 2 km

0.000567519699693

Variance slope @ 5 km

0.000655383486557

Variance slope @ 10 km

0.000654252323092

Variance slope @ 20 km

0.00035431543652


NDVI (min. NDVI composite)I


Roman et al. (2009) index


St

10.9191443908

Rcv

0.0280425257914

Rse

0.0

Rst

0.00447485562315

Rsv

0.242229420408


NDVI range @ 1km [-]

0.03

NDVI range @ 2km [-]

0.06

NDVI range @ 5km [-]

0.07

NDVI range @ 10km [-]

0.28

NDVI range @ 20km [-]

0.26


NDVI slope @ 1 km

0.000839782837908

NDVI slope @ 2 km

0.00106111321908

NDVI slope @ 5 km

0.00103291562599

NDVI slope @ 10 km

0.000877369533445

NDVI slope @ 20 km

0.000352576060219


Temporal stability analysis

+000 deg (BHR)


BHR statistics

Temporal stability [1/decade]:


abs

rel


Weighted least square:

None


Ordinary least square:

None


Probabilities that GCOS criteria is met:

Weighted least square:

None %

Ordinary least square:

None %


DHR statistics

Temporal stability [1/decade]:


abs

rel


Weighted least square:

None


Ordinary least square:

None


Probabilities that GCOS criteria is met:

Weighted least square:

None %

Ordinary least square:

None %


+057/+063 deg (BHR)


BHR statistics

Temporal stability [1/decade]:


abs

rel


Weighted least square:

None


Ordinary least square:

None


Probabilities that GCOS criteria is met:

Weighted least square:

None %

Ordinary least square:

None %


DHR statistics

Temporal stability [1/decade]:


abs

rel


Weighted least square:

None


Ordinary least square:

None


Probabilities that GCOS criteria is met:

Weighted least square:

None %

Ordinary least square:

None %


Temporal anomaly analyis

The variance of the temporal anomalies provides an additional measure about the stability of the signal AFTER removal of the mean seasonal cylce.

+000 deg


+057/+063 deg