MOBILE_KANPUR_EAST


Location

lon / lat [deg]: 80.4394 / 26.4585

Source network: AERONET


Geostationary surface albedo (GSA) data


“+000”


“+057/+063”


Landcover information (based on ESA CCI landcover data)


Landcover fractions @ 2km distance


Landcover fractions @ 20 km distance


Legend


Distance to open water bodies [km]:

1.84

Distance to urban areas [km]:

0.92


Radius: 1 km

Number of landcover classes:

3

Dominant landcover type:

20: cropland, irrigated or post-flooded

Fraction of dominant landcover type [%]:

89.0


Radius: 2 km

Number of landcover classes:

4

Dominant landcover type:

20: cropland, irrigated or post-flooded

Fraction of dominant landcover type [%]:

68.0


Radius: 5 km

Number of landcover classes:

3

Dominant landcover type:

20: cropland, irrigated or post-flooded

Fraction of dominant landcover type [%]:

43.0


Radius: 10 km

Number of landcover classes:

3

Dominant landcover type:

20: cropland, irrigated or post-flooded

Fraction of dominant landcover type [%]:

51.0


Radius: 20 km

Number of landcover classes:

3

Dominant landcover type:

20: cropland, irrigated or post-flooded

Fraction of dominant landcover type [%]:

67.0


Disturbances


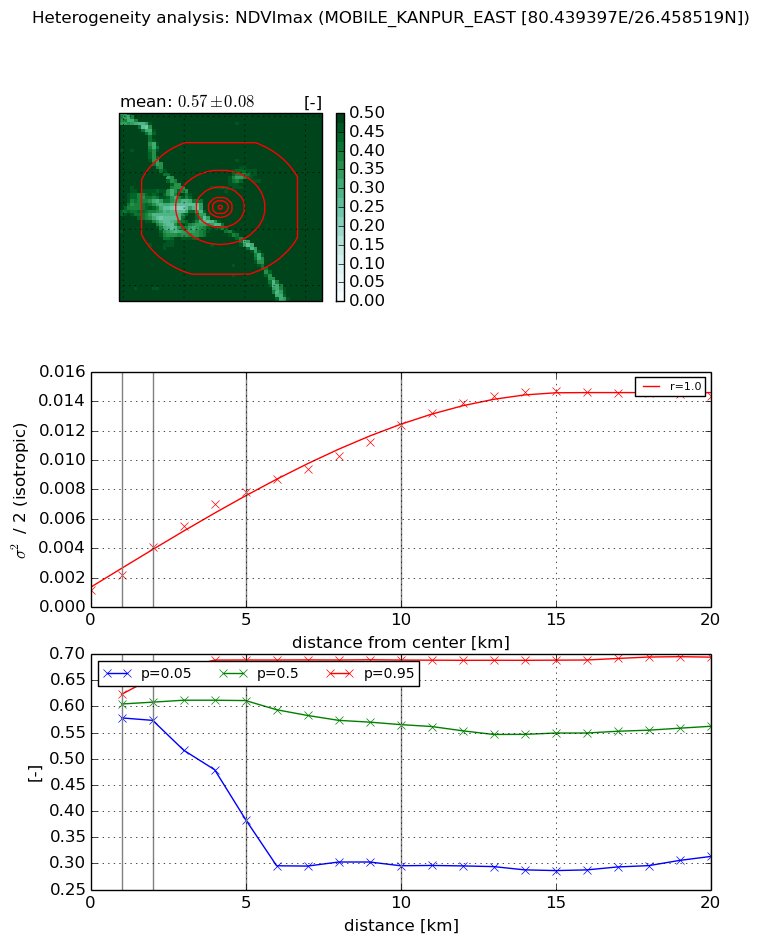
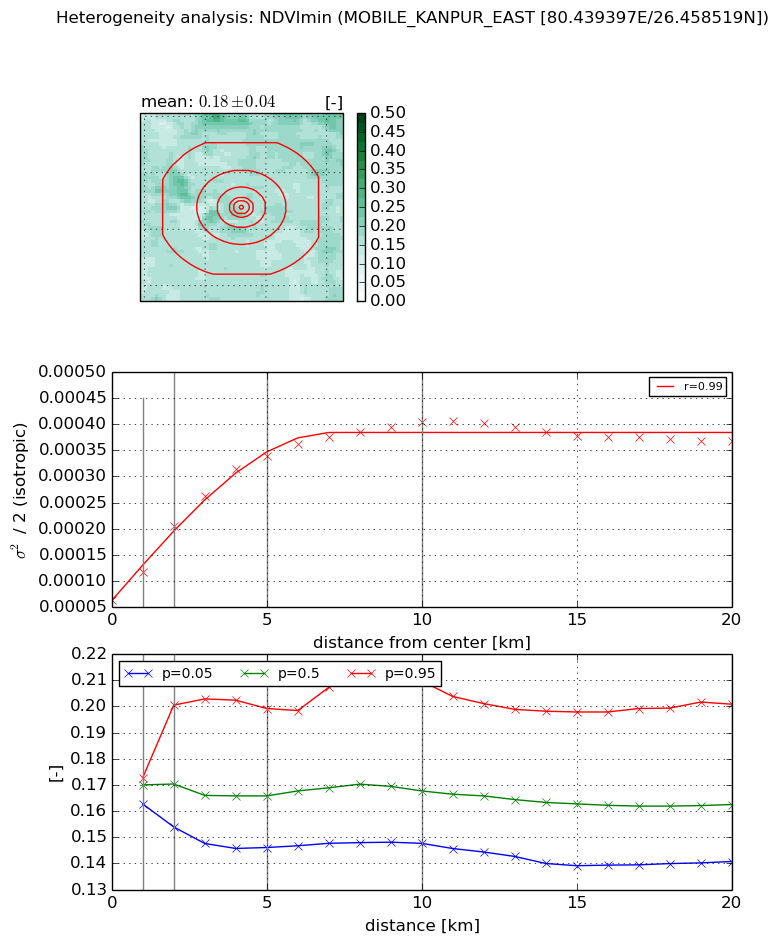
Heterogeneity analysis

The heterogeneity analysis provides information about the spatial and temporal heterogeneity of the site.

Topography


Roman et al. (2009) index


St

nan

Rcv

nan

Rse

nan

Rst

nan

Rsv

nan


Height range @ 1km [m]

4

Height range @ 2km [m]

5

Height range @ 5km [m]

15

Height range @ 10km [m]

-999

Height range @ 20km [m]

-999


Variance slope @ 1 km

8

Variance slope @ 2 km

8

Variance slope @ 5 km

5

Variance slope @ 10 km

-999

Variance slope @ 20 km

-999


NDVI (max. NDVI composite)


Roman et al. (2009) index


St

nan

Rcv

nan

Rse

nan

Rst

nan

Rsv

nan


NDVI range @ 1km [-]

0.05

NDVI range @ 2km [-]

0.08

NDVI range @ 5km [-]

0.31

NDVI range @ 10km [-]

0.39

NDVI range @ 20km [-]

0.38


Variance slope @ 1 km

0.00104865283237

Variance slope @ 2 km

0.00148036982283

Variance slope @ 5 km

0.00141114133541

Variance slope @ 10 km

0.00109432358066

Variance slope @ 20 km

0.000671913455797


NDVI (min. NDVI composite)I


Roman et al. (2009) index


St

5.22917407022

Rcv

-0.0810484595722

Rse

0.0

Rst

0.167427157939

Rsv

-0.325228749511


NDVI range @ 1km [-]

0.01

NDVI range @ 2km [-]

0.05

NDVI range @ 5km [-]

0.05

NDVI range @ 10km [-]

0.06

NDVI range @ 20km [-]

0.06


NDVI slope @ 1 km

5.3561509315e-05

NDVI slope @ 2 km

7.10262507585e-05

NDVI slope @ 5 km

5.76118616095e-05

NDVI slope @ 10 km

3.30365142168e-05

NDVI slope @ 20 km

1.06015568022e-05


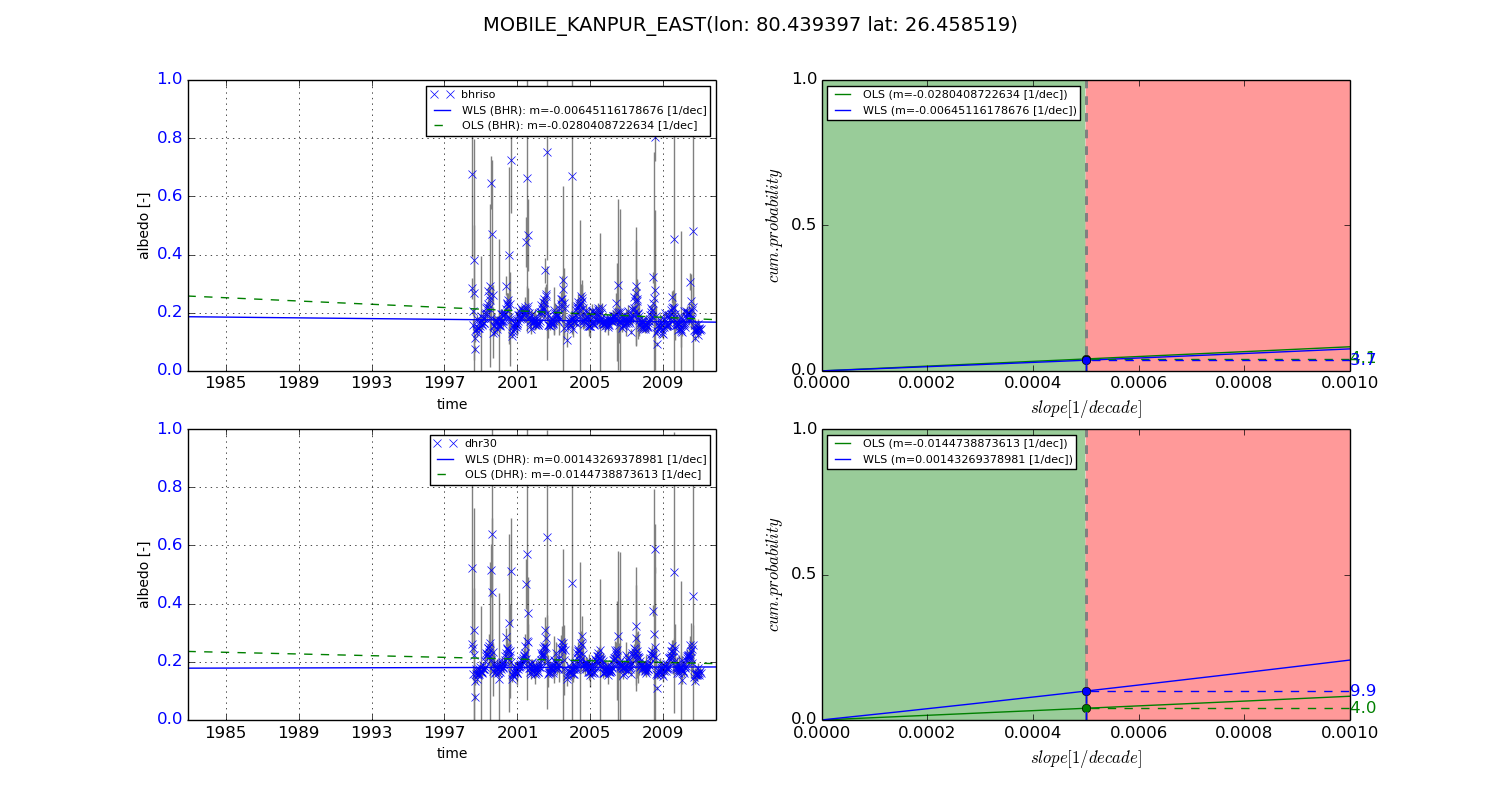
Temporal stability analysis

+000 deg (BHR)


BHR statistics

Temporal stability [1/decade]:


abs

rel


Weighted least square:

None


Ordinary least square:

None


Probabilities that GCOS criteria is met:

Weighted least square:

None %

Ordinary least square:

None %


DHR statistics

Temporal stability [1/decade]:


abs

rel


Weighted least square:

None


Ordinary least square:

None


Probabilities that GCOS criteria is met:

Weighted least square:

None %

Ordinary least square:

None %


+057/+063 deg (BHR)


BHR statistics

Temporal stability [1/decade]:


abs

rel


Weighted least square:

-0.00645116178676


Ordinary least square:

-0.0280408722634


Probabilities that GCOS criteria is met:

Weighted least square:

3.7 %

Ordinary least square:

4.1 %


DHR statistics

Temporal stability [1/decade]:


abs

rel


Weighted least square:

0.00143269378981


Ordinary least square:

-0.0144738873613


Probabilities that GCOS criteria is met:

Weighted least square:

9.9 %

Ordinary least square:

4.0 %


Temporal anomaly analyis

The variance of the temporal anomalies provides an additional measure about the stability of the signal AFTER removal of the mean seasonal cylce.

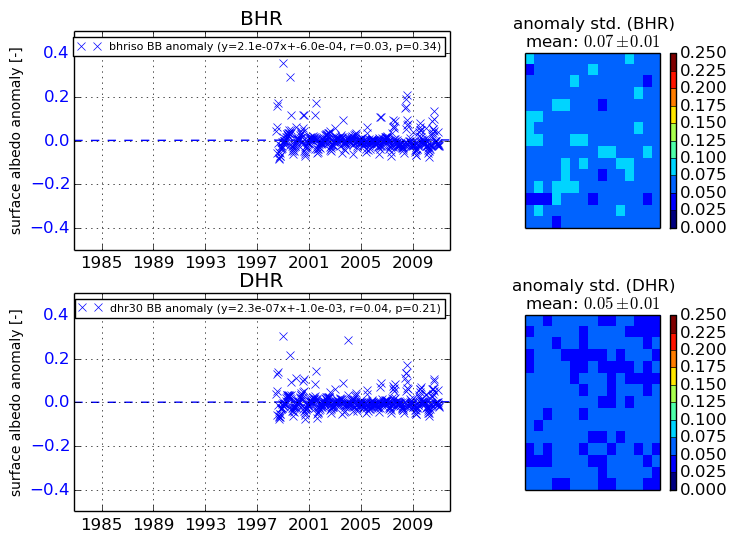
+000 deg


+057/+063 deg