MOBILE_KANPUR_W2


Location

lon / lat [deg]: 80.1217 / 26.4185

Source network: AERONET


Geostationary surface albedo (GSA) data


“+000”


“+057/+063”


Landcover information (based on ESA CCI landcover data)


Landcover fractions @ 2km distance


Landcover fractions @ 20 km distance


Legend


Distance to open water bodies [km]:

9.71

Distance to urban areas [km]:

0.65


Radius: 1 km

Number of landcover classes:

3

Dominant landcover type:

20: cropland, irrigated or post-flooded

Fraction of dominant landcover type [%]:

76.0


Radius: 2 km

Number of landcover classes:

3

Dominant landcover type:

20: cropland, irrigated or post-flooded

Fraction of dominant landcover type [%]:

84.0


Radius: 5 km

Number of landcover classes:

4

Dominant landcover type:

20: cropland, irrigated or post-flooded

Fraction of dominant landcover type [%]:

90.0


Radius: 10 km

Number of landcover classes:

3

Dominant landcover type:

20: cropland, irrigated or post-flooded

Fraction of dominant landcover type [%]:

94.0


Radius: 20 km

Number of landcover classes:

3

Dominant landcover type:

20: cropland, irrigated or post-flooded

Fraction of dominant landcover type [%]:

89.0


Disturbances


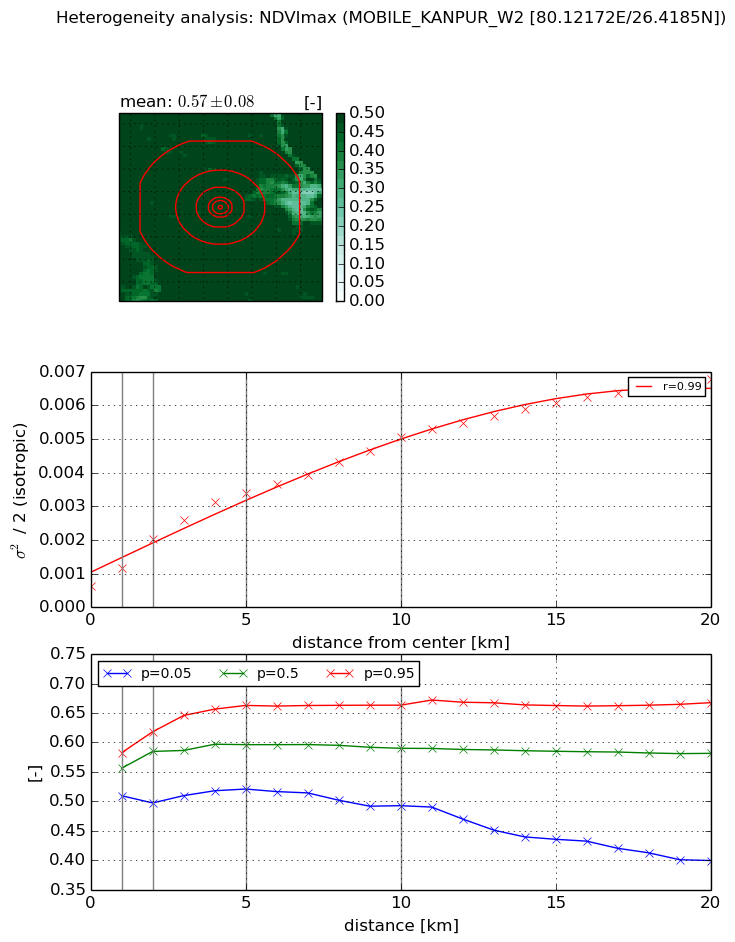
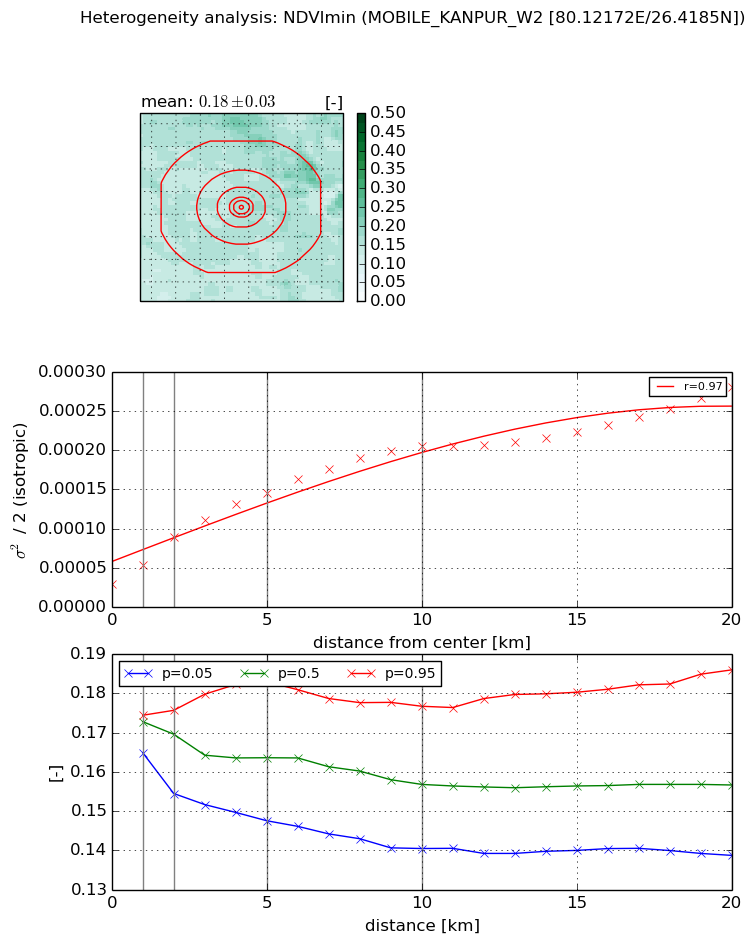
Heterogeneity analysis

The heterogeneity analysis provides information about the spatial and temporal heterogeneity of the site.

Topography


Roman et al. (2009) index


St

3.80954272196

Rcv

-0.0582736315455

Rse

0.0

Rst

-0.097895997817

Rsv

0.631326461103


Height range @ 1km [m]

6

Height range @ 2km [m]

8

Height range @ 5km [m]

7

Height range @ 10km [m]

-999

Height range @ 20km [m]

-999


Variance slope @ 1 km

2

Variance slope @ 2 km

1

Variance slope @ 5 km

0

Variance slope @ 10 km

-999

Variance slope @ 20 km

-999


NDVI (max. NDVI composite)


Roman et al. (2009) index


St

6.20671764614

Rcv

-0.060177338323

Rse

0.0

Rst

0.153865648127

Rsv

-0.269304278729


NDVI range @ 1km [-]

0.07

NDVI range @ 2km [-]

0.12

NDVI range @ 5km [-]

0.14

NDVI range @ 10km [-]

0.17

NDVI range @ 20km [-]

0.27


Variance slope @ 1 km

0.00053159986444

Variance slope @ 2 km

0.000704295994206

Variance slope @ 5 km

0.000580312900271

Variance slope @ 10 km

0.000419139365522

Variance slope @ 20 km

0.000286858921155


NDVI (min. NDVI composite)I


Roman et al. (2009) index


St

3.12904187026

Rcv

0.212663651887

Rse

0.0

Rst

0.0753379794805

Rsv

0.670758309978


NDVI range @ 1km [-]

0.01

NDVI range @ 2km [-]

0.02

NDVI range @ 5km [-]

0.04

NDVI range @ 10km [-]

0.04

NDVI range @ 20km [-]

0.05


NDVI slope @ 1 km

2.37132850071e-05

NDVI slope @ 2 km

2.99280237623e-05

NDVI slope @ 5 km

2.38536352347e-05

NDVI slope @ 10 km

1.74722608454e-05

NDVI slope @ 20 km

1.03741345141e-05


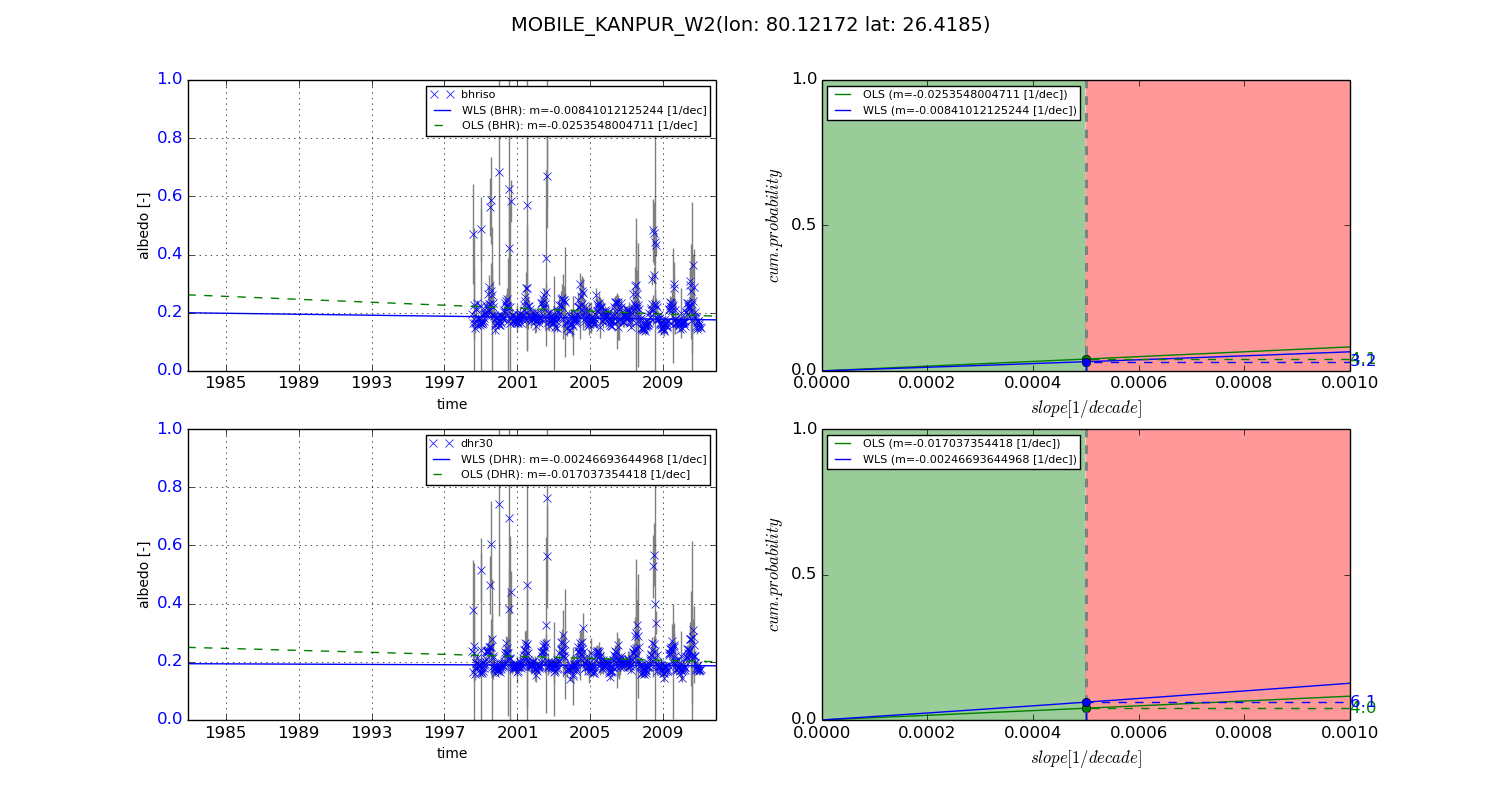
Temporal stability analysis

+000 deg (BHR)


BHR statistics

Temporal stability [1/decade]:


abs

rel


Weighted least square:

-99999.0


Ordinary least square:

-99999.0


Probabilities that GCOS criteria is met:

Weighted least square:

-99999.0 %

Ordinary least square:

-99999.0 %


DHR statistics

Temporal stability [1/decade]:


abs

rel


Weighted least square:

-99999.0


Ordinary least square:

-99999.0


Probabilities that GCOS criteria is met:

Weighted least square:

-99999.0 %

Ordinary least square:

-99999.0 %


+057/+063 deg (BHR)


BHR statistics

Temporal stability [1/decade]:


abs

rel


Weighted least square:

-0.00841012125244


Ordinary least square:

-0.0253548004711


Probabilities that GCOS criteria is met:

Weighted least square:

3.2 %

Ordinary least square:

4.1 %


DHR statistics

Temporal stability [1/decade]:


abs

rel


Weighted least square:

-0.00246693644968


Ordinary least square:

-0.017037354418


Probabilities that GCOS criteria is met:

Weighted least square:

6.1 %

Ordinary least square:

4.0 %


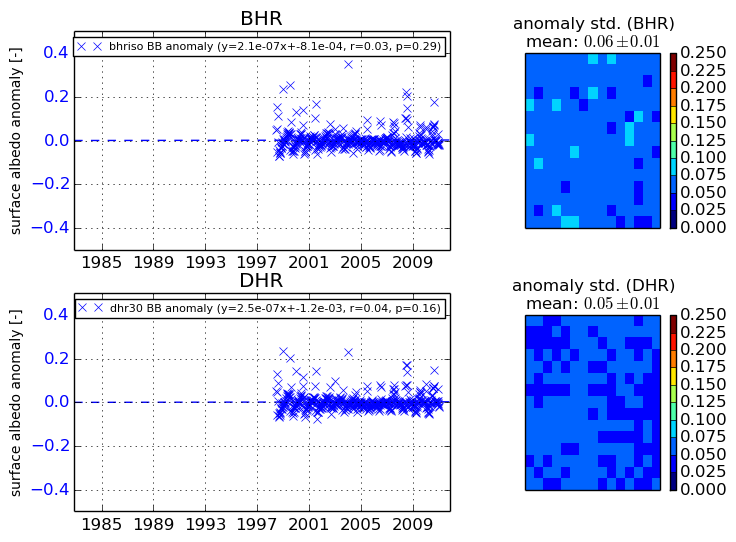
Temporal anomaly analyis

The variance of the temporal anomalies provides an additional measure about the stability of the signal AFTER removal of the mean seasonal cylce.

+000 deg


+057/+063 deg