MOBILE_N_051308W


Location

lon / lat [deg]: 78.7776 / 26.9943

Source network: AERONET


Geostationary surface albedo (GSA) data


“+000”


“+057/+063”


Landcover information (based on ESA CCI landcover data)


Landcover fractions @ 2km distance


Landcover fractions @ 20 km distance


Legend


Distance to open water bodies [km]:

5.27

Distance to urban areas [km]:

9.71


Radius: 1 km

Number of landcover classes:

1

Dominant landcover type:

20: cropland, irrigated or post-flooded

Fraction of dominant landcover type [%]:

100.0


Radius: 2 km

Number of landcover classes:

1

Dominant landcover type:

20: cropland, irrigated or post-flooded

Fraction of dominant landcover type [%]:

100.0


Radius: 5 km

Number of landcover classes:

1

Dominant landcover type:

20: cropland, irrigated or post-flooded

Fraction of dominant landcover type [%]:

100.0


Radius: 10 km

Number of landcover classes:

4

Dominant landcover type:

20: cropland, irrigated or post-flooded

Fraction of dominant landcover type [%]:

94.0


Radius: 20 km

Number of landcover classes:

4

Dominant landcover type:

20: cropland, irrigated or post-flooded

Fraction of dominant landcover type [%]:

80.0


Disturbances


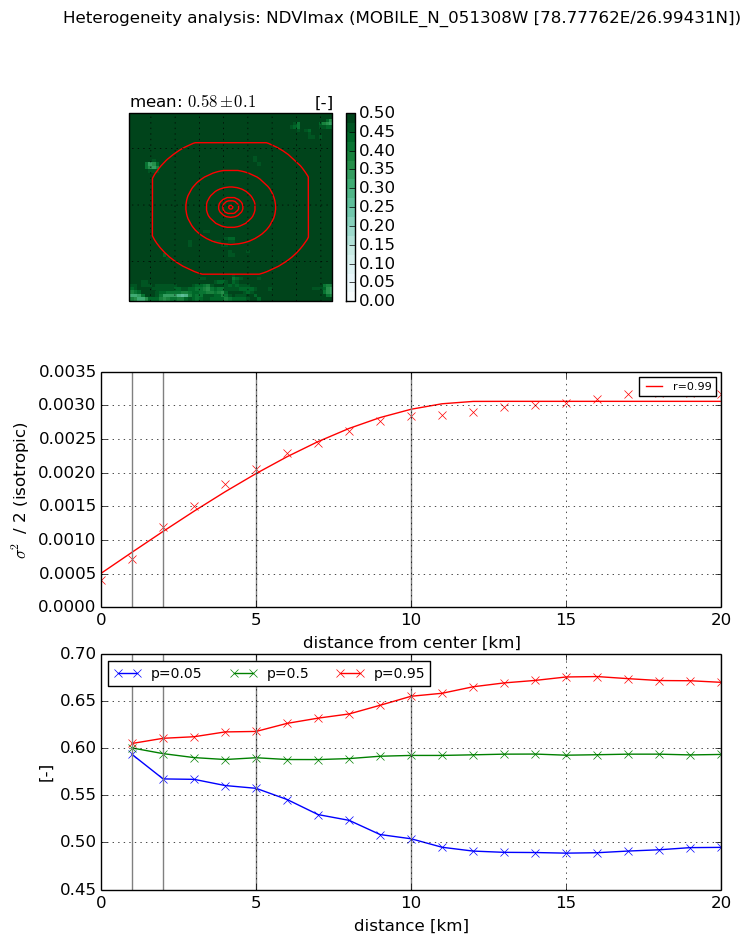
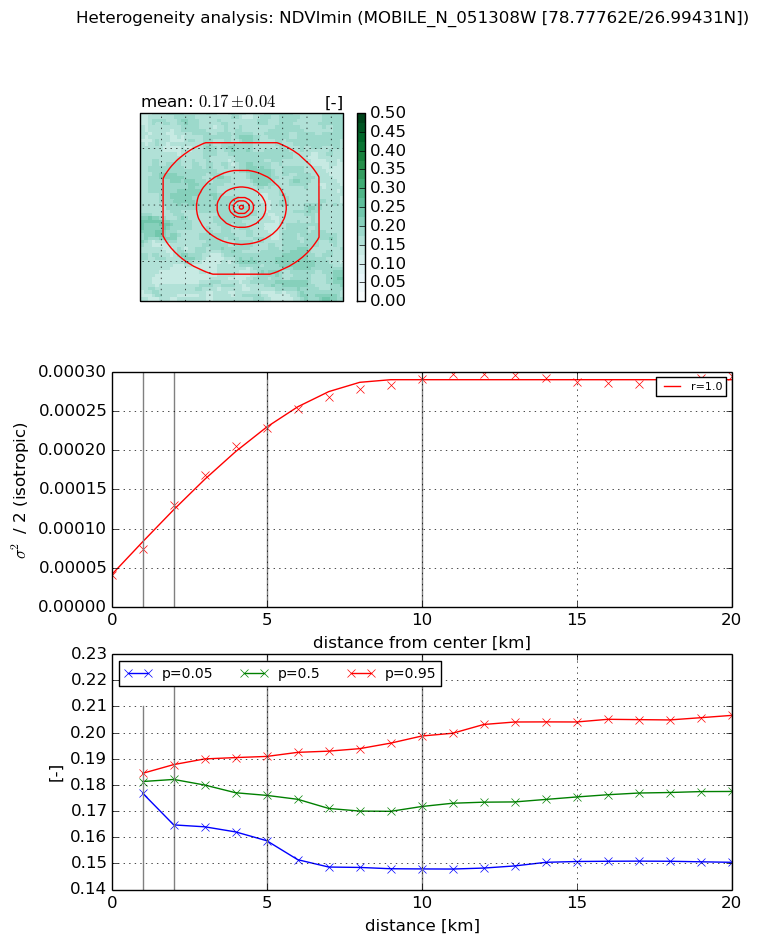
Heterogeneity analysis

The heterogeneity analysis provides information about the spatial and temporal heterogeneity of the site.

Topography


Roman et al. (2009) index


St

3.61026996654

Rcv

0.0639422912671

Rse

0.0

Rst

-0.0524767720748

Rsv

-0.714543725537


Height range @ 1km [m]

5

Height range @ 2km [m]

6

Height range @ 5km [m]

6

Height range @ 10km [m]

-999

Height range @ 20km [m]

-999


Variance slope @ 1 km

1

Variance slope @ 2 km

0

Variance slope @ 5 km

0

Variance slope @ 10 km

-999

Variance slope @ 20 km

-999


NDVI (max. NDVI composite)


Roman et al. (2009) index


St

2.06749931002

Rcv

0.153606949709

Rse

0.0

Rst

-0.343577371815

Rsv

0.953843974087


NDVI range @ 1km [-]

0.01

NDVI range @ 2km [-]

0.04

NDVI range @ 5km [-]

0.06

NDVI range @ 10km [-]

0.15

NDVI range @ 20km [-]

0.18


Variance slope @ 1 km

0.00031014297077

Variance slope @ 2 km

0.000397529021813

Variance slope @ 5 km

0.000341526485916

Variance slope @ 10 km

0.000245720652294

Variance slope @ 20 km

0.000123539207757


NDVI (min. NDVI composite)I


Roman et al. (2009) index


St

2.20291053153

Rcv

0.162947567432

Rse

0.0

Rst

-0.19888721864

Rsv

-0.999999912641


NDVI range @ 1km [-]

0.01

NDVI range @ 2km [-]

0.02

NDVI range @ 5km [-]

0.03

NDVI range @ 10km [-]

0.05

NDVI range @ 20km [-]

0.06


NDVI slope @ 1 km

3.39202004091e-05

NDVI slope @ 2 km

4.48977680498e-05

NDVI slope @ 5 km

3.92896746201e-05

NDVI slope @ 10 km

2.52756596305e-05

NDVI slope @ 20 km

9.91689624104e-06


Temporal stability analysis

+000 deg (BHR)


BHR statistics

Temporal stability [1/decade]:


abs

rel


Weighted least square:

-99999.0


Ordinary least square:

-99999.0


Probabilities that GCOS criteria is met:

Weighted least square:

-99999.0 %

Ordinary least square:

-99999.0 %


DHR statistics

Temporal stability [1/decade]:


abs

rel


Weighted least square:

-99999.0


Ordinary least square:

-99999.0


Probabilities that GCOS criteria is met:

Weighted least square:

-99999.0 %

Ordinary least square:

-99999.0 %


+057/+063 deg (BHR)


BHR statistics

Temporal stability [1/decade]:


abs

rel


Weighted least square:

0.000318649739906


Ordinary least square:

-0.00591131655734


Probabilities that GCOS criteria is met:

Weighted least square:

12.8 %

Ordinary least square:

4.5 %


DHR statistics

Temporal stability [1/decade]:


abs

rel


Weighted least square:

0.00577441247461


Ordinary least square:

-0.00158415619661


Probabilities that GCOS criteria is met:

Weighted least square:

0.0 %

Ordinary least square:

6.0 %


Temporal anomaly analyis

The variance of the temporal anomalies provides an additional measure about the stability of the signal AFTER removal of the mean seasonal cylce.

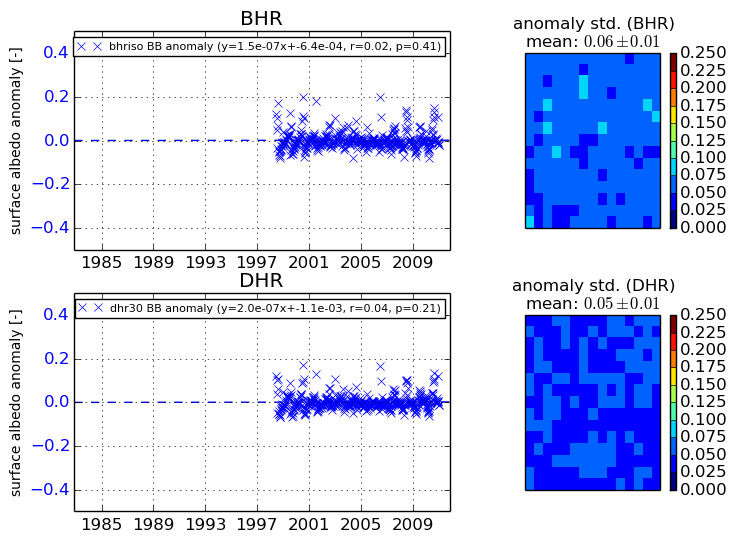
+000 deg


+057/+063 deg


By continuing to use this website, you are giving consent to analytic cookies being used. For more information on how EUMETSAT uses data and how you can disable this, please view this web page: Analytics Cookie Policy