MOBILE_N_052908W


Location

lon / lat [deg]: 78.8266 / 26.9524

Source network: AERONET


Geostationary surface albedo (GSA) data


“+000”


“+057/+063”


Landcover information (based on ESA CCI landcover data)


Landcover fractions @ 2km distance


Landcover fractions @ 20 km distance


Legend


Distance to open water bodies [km]:

1.75

Distance to urban areas [km]:

10.37


Radius: 1 km

Number of landcover classes:

1

Dominant landcover type:

20: cropland, irrigated or post-flooded

Fraction of dominant landcover type [%]:

100.0


Radius: 2 km

Number of landcover classes:

1

Dominant landcover type:

20: cropland, irrigated or post-flooded

Fraction of dominant landcover type [%]:

99.0


Radius: 5 km

Number of landcover classes:

1

Dominant landcover type:

20: cropland, irrigated or post-flooded

Fraction of dominant landcover type [%]:

99.0


Radius: 10 km

Number of landcover classes:

3

Dominant landcover type:

20: cropland, irrigated or post-flooded

Fraction of dominant landcover type [%]:

86.0


Radius: 20 km

Number of landcover classes:

4

Dominant landcover type:

20: cropland, irrigated or post-flooded

Fraction of dominant landcover type [%]:

78.0


Disturbances


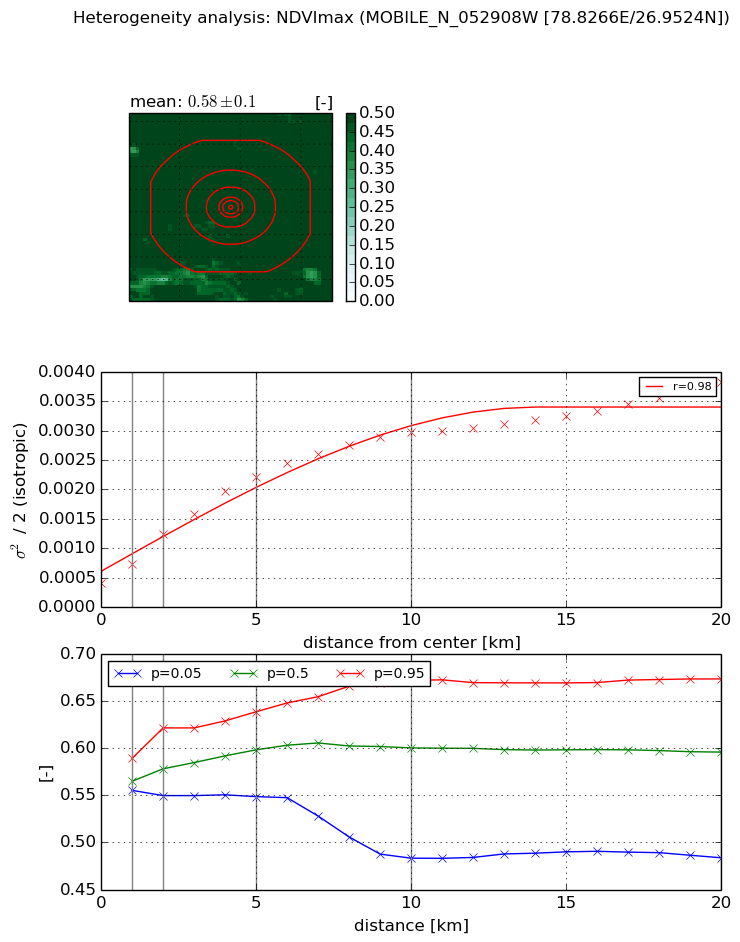
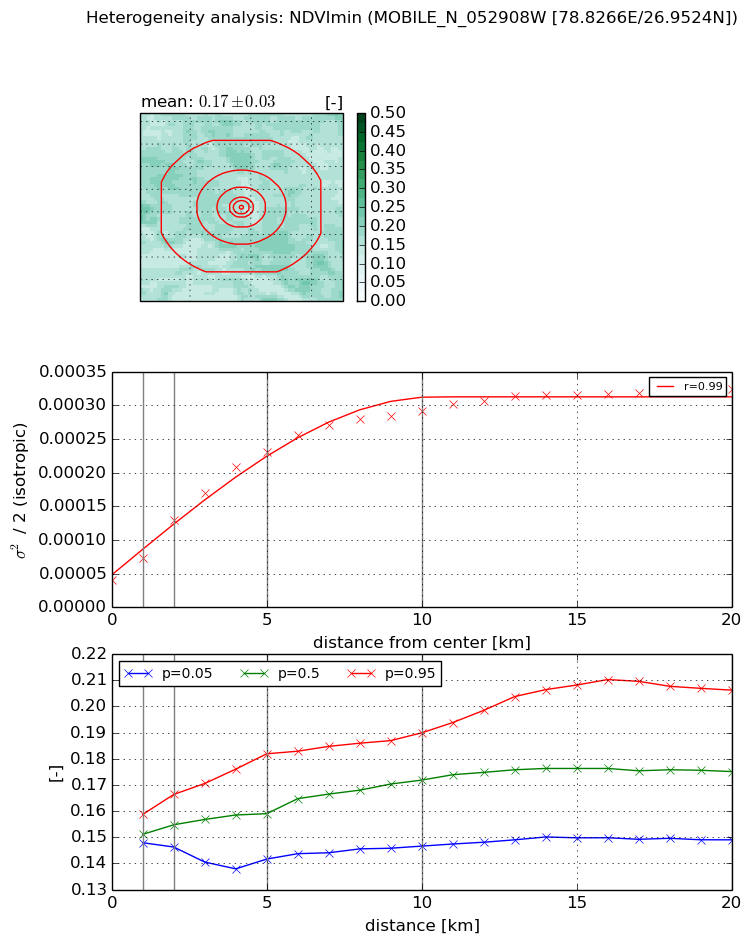
Heterogeneity analysis

The heterogeneity analysis provides information about the spatial and temporal heterogeneity of the site.

Topography


Roman et al. (2009) index


St

0.00560023426844

Rcv

0.119302279184

Rse

0.0

Rst

-6.78412757093e-06

Rsv

535.572566705


Height range @ 1km [m]

5

Height range @ 2km [m]

5

Height range @ 5km [m]

7

Height range @ 10km [m]

-999

Height range @ 20km [m]

-999


Variance slope @ 1 km

1

Variance slope @ 2 km

1

Variance slope @ 5 km

0

Variance slope @ 10 km

-999

Variance slope @ 20 km

-999


NDVI (max. NDVI composite)


Roman et al. (2009) index


St

2.68475682563

Rcv

0.132220128443

Rse

0.0

Rst

-0.310890655502

Rsv

0.674308853974


NDVI range @ 1km [-]

0.03

NDVI range @ 2km [-]

0.07

NDVI range @ 5km [-]

0.09

NDVI range @ 10km [-]

0.19

NDVI range @ 20km [-]

0.19


Variance slope @ 1 km

0.000320686999387

Variance slope @ 2 km

0.000414325145621

Variance slope @ 5 km

0.000374470893688

Variance slope @ 10 km

0.000259381613676

Variance slope @ 20 km

0.000144031427782


NDVI (min. NDVI composite)I


Roman et al. (2009) index


St

0.000130686136789

Rcv

0.248270575815

Rse

0.0

Rst

0.267556264905

Rsv

22955.2472992


NDVI range @ 1km [-]

0.01

NDVI range @ 2km [-]

0.02

NDVI range @ 5km [-]

0.04

NDVI range @ 10km [-]

0.04

NDVI range @ 20km [-]

0.06


NDVI slope @ 1 km

3.36155985522e-05

NDVI slope @ 2 km

4.50947167442e-05

NDVI slope @ 5 km

4.00329129074e-05

NDVI slope @ 10 km

2.54579606023e-05

NDVI slope @ 20 km

1.19871610815e-05


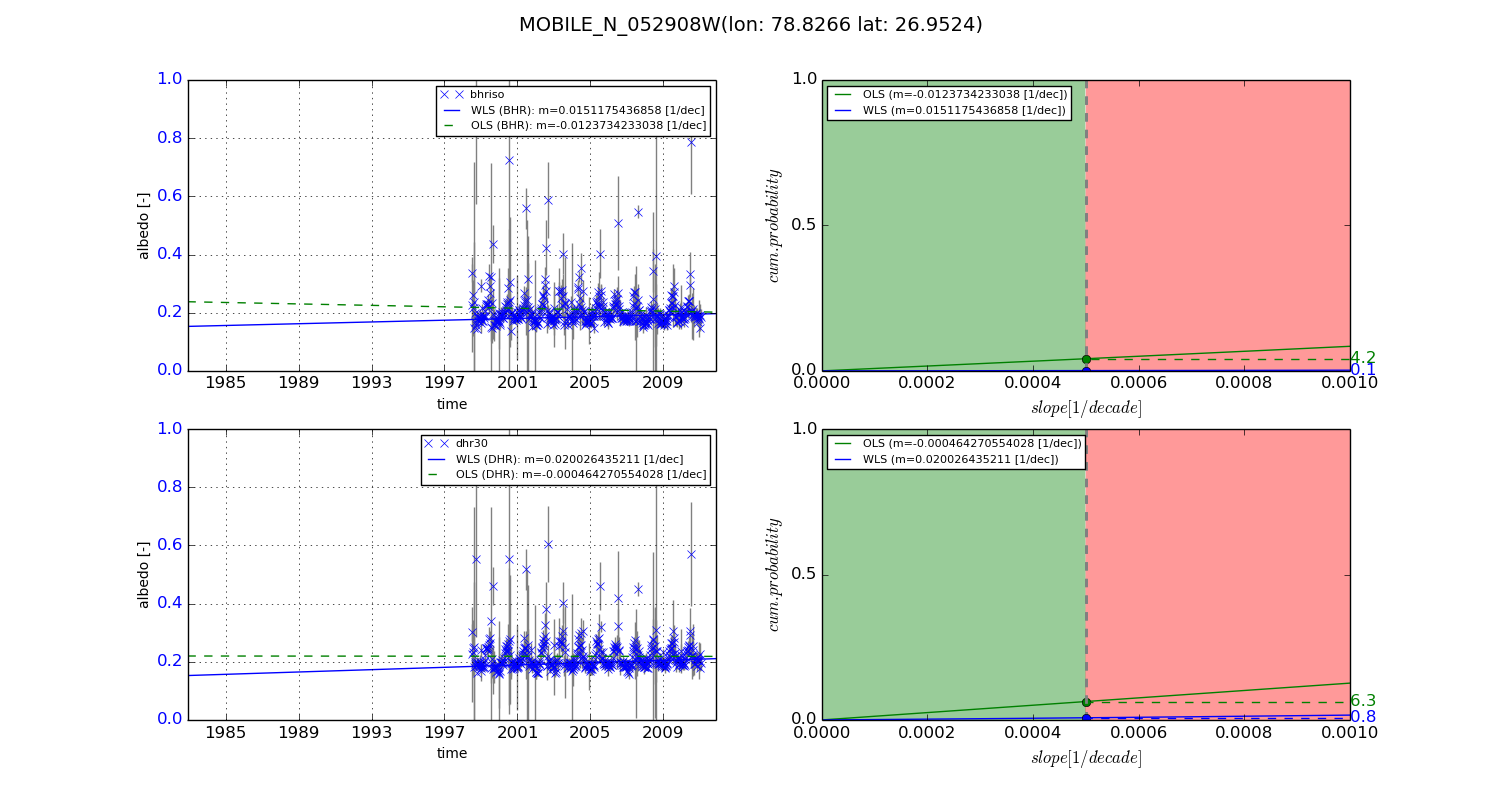
Temporal stability analysis

+000 deg (BHR)


BHR statistics

Temporal stability [1/decade]:


abs

rel


Weighted least square:

-99999.0


Ordinary least square:

-99999.0


Probabilities that GCOS criteria is met:

Weighted least square:

-99999.0 %

Ordinary least square:

-99999.0 %


DHR statistics

Temporal stability [1/decade]:


abs

rel


Weighted least square:

-99999.0


Ordinary least square:

-99999.0


Probabilities that GCOS criteria is met:

Weighted least square:

-99999.0 %

Ordinary least square:

-99999.0 %


+057/+063 deg (BHR)


BHR statistics

Temporal stability [1/decade]:


abs

rel


Weighted least square:

0.0151175436858


Ordinary least square:

-0.0123734233038


Probabilities that GCOS criteria is met:

Weighted least square:

0.1 %

Ordinary least square:

4.2 %


DHR statistics

Temporal stability [1/decade]:


abs

rel


Weighted least square:

0.020026435211


Ordinary least square:

-0.000464270554028


Probabilities that GCOS criteria is met:

Weighted least square:

0.8 %

Ordinary least square:

6.3 %


Temporal anomaly analyis

The variance of the temporal anomalies provides an additional measure about the stability of the signal AFTER removal of the mean seasonal cylce.

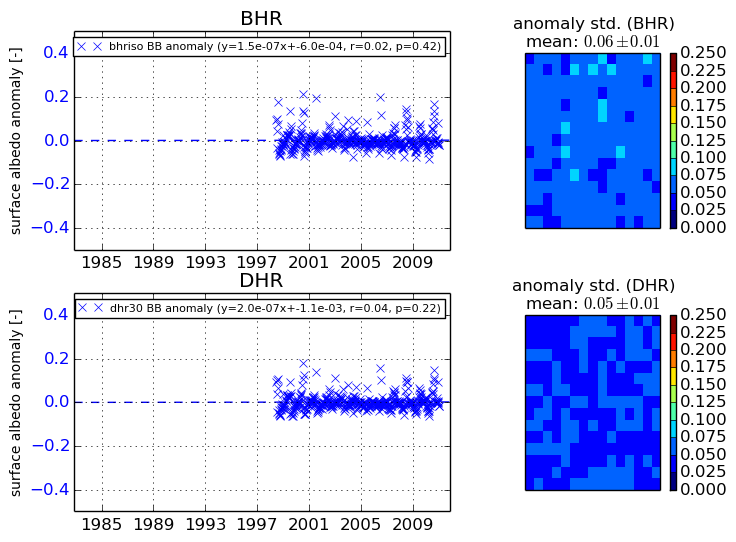
+000 deg


+057/+063 deg