MOBILE_S_011509_ND


Location

lon / lat [deg]: 76.9396 / 28.3482

Source network: AERONET


Geostationary surface albedo (GSA) data


“+000”


“+057/+063”


Landcover information (based on ESA CCI landcover data)


Landcover fractions @ 2km distance


Landcover fractions @ 20 km distance


Legend


Distance to open water bodies [km]:

23.19

Distance to urban areas [km]:

9.89


Radius: 1 km

Number of landcover classes:

3

Dominant landcover type:

20: cropland, irrigated or post-flooded

Fraction of dominant landcover type [%]:

66.0


Radius: 2 km

Number of landcover classes:

3

Dominant landcover type:

20: cropland, irrigated or post-flooded

Fraction of dominant landcover type [%]:

70.0


Radius: 5 km

Number of landcover classes:

4

Dominant landcover type:

20: cropland, irrigated or post-flooded

Fraction of dominant landcover type [%]:

69.0


Radius: 10 km

Number of landcover classes:

3

Dominant landcover type:

20: cropland, irrigated or post-flooded

Fraction of dominant landcover type [%]:

74.0


Radius: 20 km

Number of landcover classes:

6

Dominant landcover type:

20: cropland, irrigated or post-flooded

Fraction of dominant landcover type [%]:

73.0


Disturbances


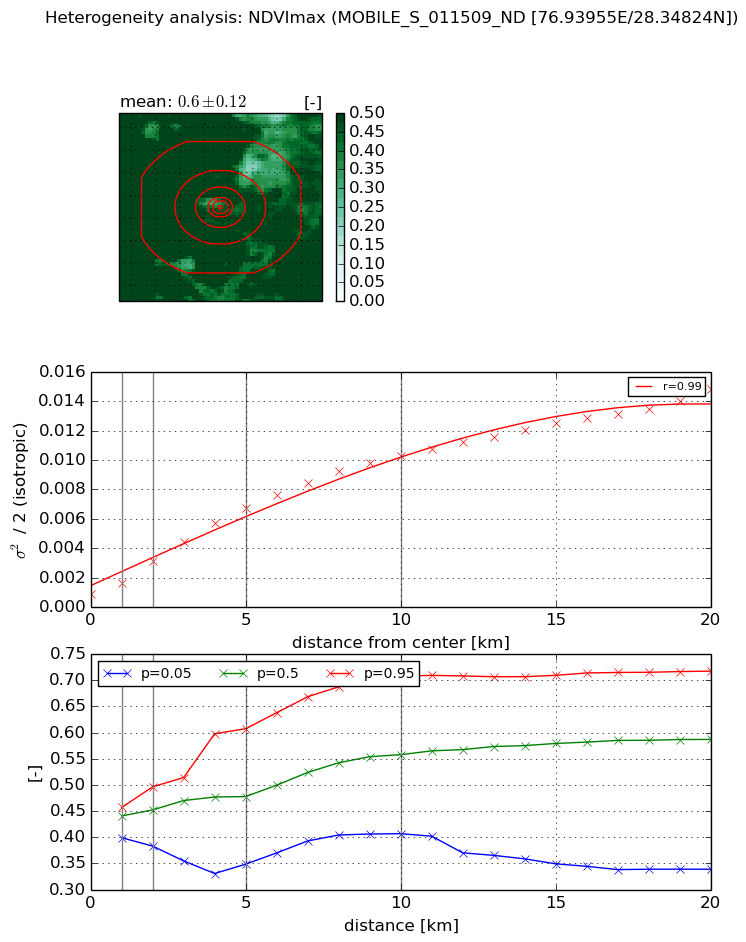
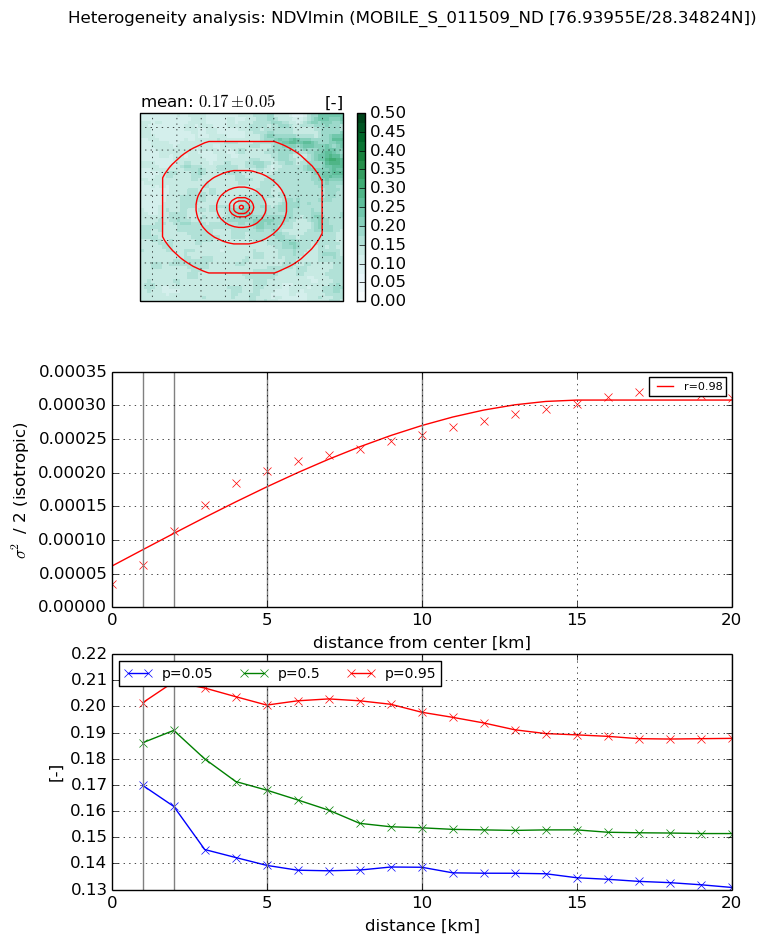
Heterogeneity analysis

The heterogeneity analysis provides information about the spatial and temporal heterogeneity of the site.

Topography


Roman et al. (2009) index


St

2.34822504044

Rcv

0.277558145907

Rse

0.0

Rst

-2.54373040855e-06

Rsv

-0.999999999111


Height range @ 1km [m]

41

Height range @ 2km [m]

49

Height range @ 5km [m]

82

Height range @ 10km [m]

-999

Height range @ 20km [m]

-999


Variance slope @ 1 km

165

Variance slope @ 2 km

130

Variance slope @ 5 km

101

Variance slope @ 10 km

-999

Variance slope @ 20 km

-999


NDVI (max. NDVI composite)


Roman et al. (2009) index


St

5.10727466377

Rcv

0.2950683644

Rse

0.0

Rst

0.101019609865

Rsv

-0.191309453423


NDVI range @ 1km [-]

0.06

NDVI range @ 2km [-]

0.11

NDVI range @ 5km [-]

0.26

NDVI range @ 10km [-]

0.3

NDVI range @ 20km [-]

0.38


Variance slope @ 1 km

0.000774369436626

Variance slope @ 2 km

0.00113319388945

Variance slope @ 5 km

0.00122259046984

Variance slope @ 10 km

0.000979807516209

Variance slope @ 20 km

0.000647070418584


NDVI (min. NDVI composite)I


Roman et al. (2009) index


St

4.98334505728

Rcv

0.0738888206001

Rse

0.0

Rst

-0.0955243287217

Rsv

0.432592123345


NDVI range @ 1km [-]

0.03

NDVI range @ 2km [-]

0.05

NDVI range @ 5km [-]

0.06

NDVI range @ 10km [-]

0.06

NDVI range @ 20km [-]

0.06


NDVI slope @ 1 km

2.90199357197e-05

NDVI slope @ 2 km

3.99650523017e-05

NDVI slope @ 5 km

3.55826418186e-05

NDVI slope @ 10 km

2.17756385037e-05

NDVI slope @ 20 km

1.26599590681e-05


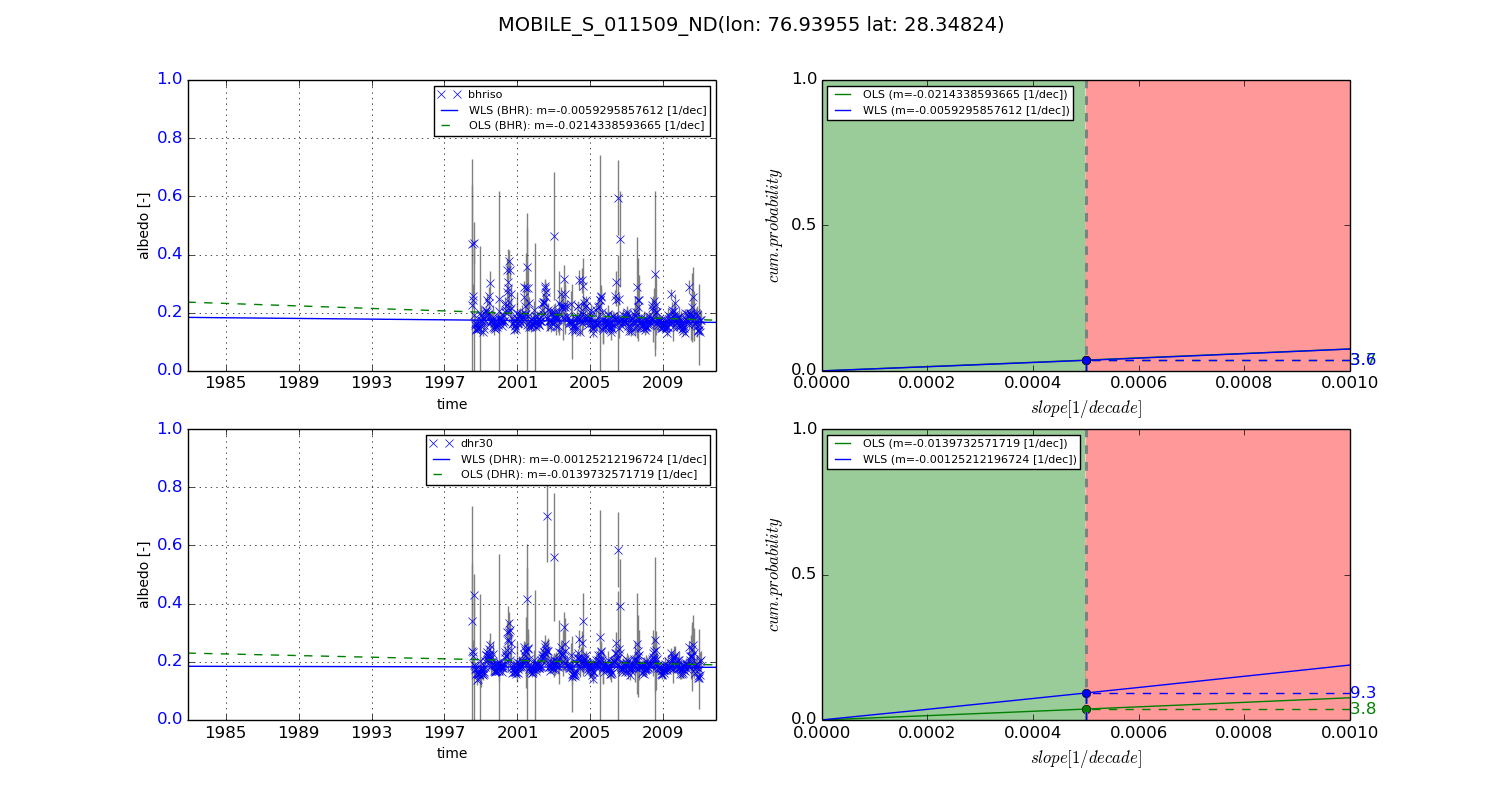
Temporal stability analysis

+000 deg (BHR)


BHR statistics

Temporal stability [1/decade]:


abs

rel


Weighted least square:

-99999.0


Ordinary least square:

-99999.0


Probabilities that GCOS criteria is met:

Weighted least square:

-99999.0 %

Ordinary least square:

-99999.0 %


DHR statistics

Temporal stability [1/decade]:


abs

rel


Weighted least square:

-99999.0


Ordinary least square:

-99999.0


Probabilities that GCOS criteria is met:

Weighted least square:

-99999.0 %

Ordinary least square:

-99999.0 %


+057/+063 deg (BHR)


BHR statistics

Temporal stability [1/decade]:


abs

rel


Weighted least square:

-0.0059295857612


Ordinary least square:

-0.0214338593665


Probabilities that GCOS criteria is met:

Weighted least square:

3.6 %

Ordinary least square:

3.7 %


DHR statistics

Temporal stability [1/decade]:


abs

rel


Weighted least square:

-0.00125212196724


Ordinary least square:

-0.0139732571719


Probabilities that GCOS criteria is met:

Weighted least square:

9.3 %

Ordinary least square:

3.8 %


Temporal anomaly analyis

The variance of the temporal anomalies provides an additional measure about the stability of the signal AFTER removal of the mean seasonal cylce.

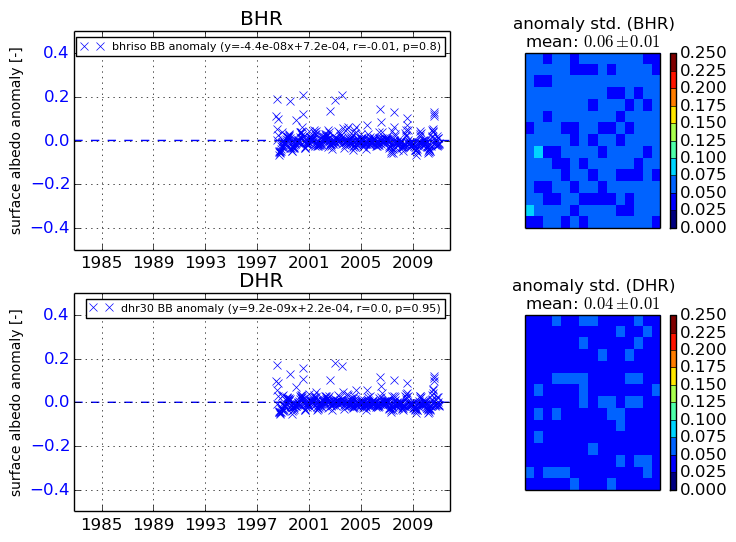
+000 deg


+057/+063 deg