MOBILE_S_051308W


Location

lon / lat [deg]: 78.8699 / 26.636

Source network: AERONET


Geostationary surface albedo (GSA) data


“+000”


“+057/+063”


Landcover information (based on ESA CCI landcover data)


Landcover fractions @ 2km distance


Landcover fractions @ 20 km distance


Legend


Distance to open water bodies [km]:

6.98

Distance to urban areas [km]:

1.62


Radius: 1 km

Number of landcover classes:

4

Dominant landcover type:

40: mosaic natural vegetation (tree, shrub, herbaceous cover) (>50%) / cropland (<50%)

Fraction of dominant landcover type [%]:

43.0


Radius: 2 km

Number of landcover classes:

5

Dominant landcover type:

40: mosaic natural vegetation (tree, shrub, herbaceous cover) (>50%) / cropland (<50%)

Fraction of dominant landcover type [%]:

40.0


Radius: 5 km

Number of landcover classes:

4

Dominant landcover type:

10: cropland, rainfed

Fraction of dominant landcover type [%]:

35.0


Radius: 10 km

Number of landcover classes:

6

Dominant landcover type:

20: cropland, irrigated or post-flooded

Fraction of dominant landcover type [%]:

39.0


Radius: 20 km

Number of landcover classes:

6

Dominant landcover type:

20: cropland, irrigated or post-flooded

Fraction of dominant landcover type [%]:

35.0


Disturbances


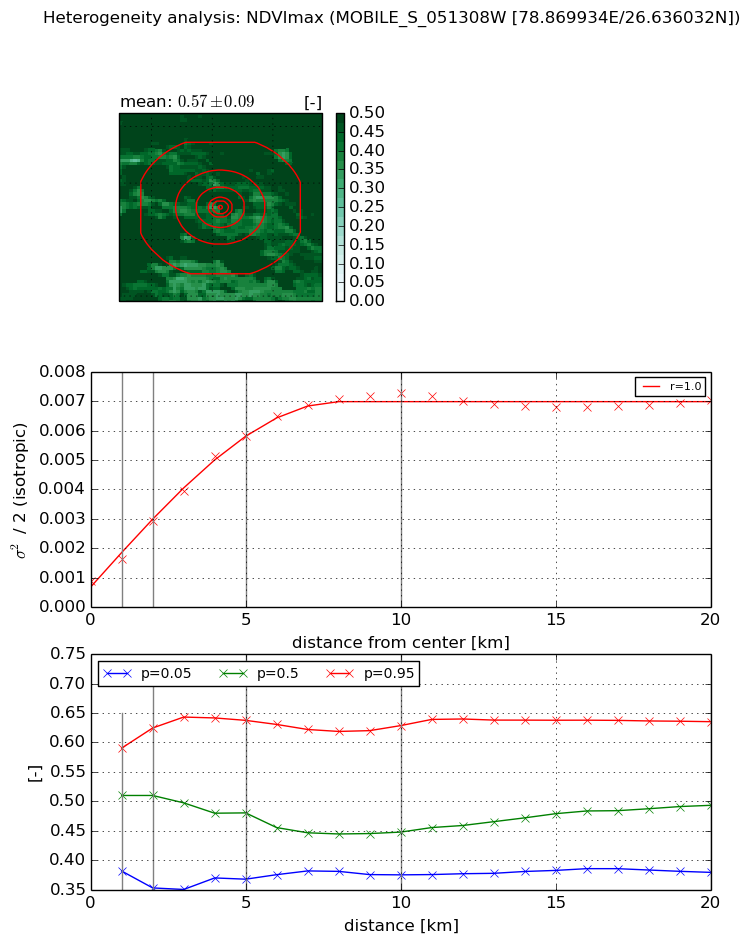
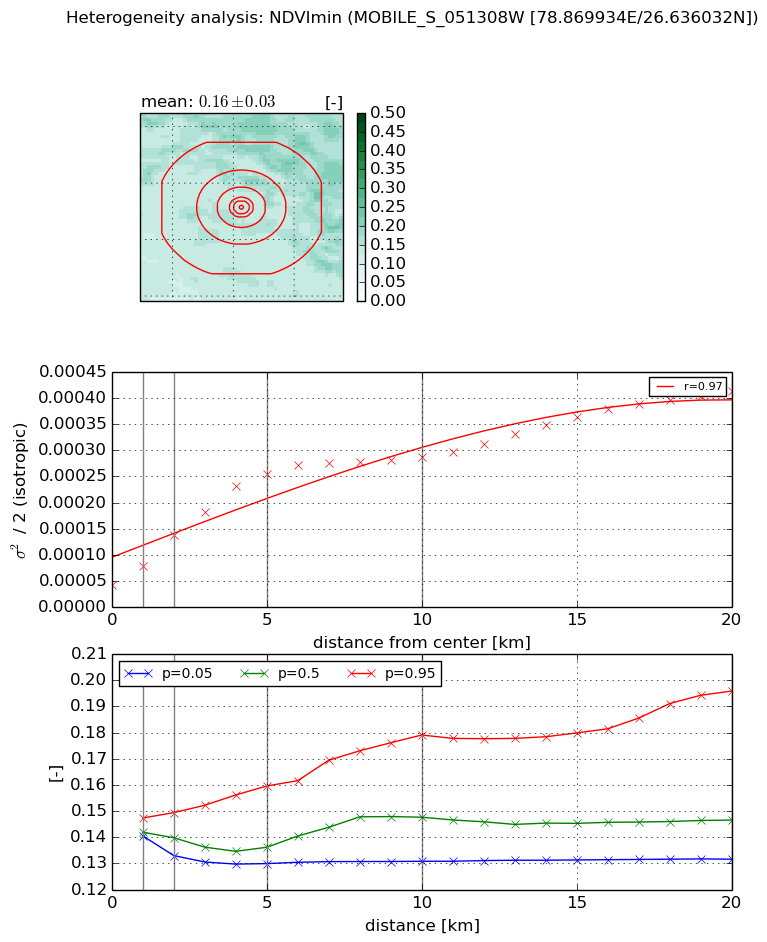
Heterogeneity analysis

The heterogeneity analysis provides information about the spatial and temporal heterogeneity of the site.

Topography


Roman et al. (2009) index


St

2.88873195343e-07

Rcv

0.0754993749816

Rse

0.0

Rst

-0.0110936108856

Rsv

10385179.4606


Height range @ 1km [m]

13

Height range @ 2km [m]

16

Height range @ 5km [m]

21

Height range @ 10km [m]

-999

Height range @ 20km [m]

-999


Variance slope @ 1 km

14

Variance slope @ 2 km

13

Variance slope @ 5 km

9

Variance slope @ 10 km

-999

Variance slope @ 20 km

-999


NDVI (max. NDVI composite)


Roman et al. (2009) index


St

13.6733110216

Rcv

-0.0769424399106

Rse

0.0

Rst

-0.0469947563664

Rsv

0.0954683299537


NDVI range @ 1km [-]

0.21

NDVI range @ 2km [-]

0.27

NDVI range @ 5km [-]

0.27

NDVI range @ 10km [-]

0.25

NDVI range @ 20km [-]

0.26


Variance slope @ 1 km

0.000752877300219

Variance slope @ 2 km

0.00101770598081

Variance slope @ 5 km

0.00103093930521

Variance slope @ 10 km

0.000669567082208

Variance slope @ 20 km

0.000230247690109


NDVI (min. NDVI composite)I


Roman et al. (2009) index


St

1.91293935042

Rcv

0.278082671507

Rse

0.0

Rst

-0.290184633858

Rsv

-0.999999874326


NDVI range @ 1km [-]

0.01

NDVI range @ 2km [-]

0.02

NDVI range @ 5km [-]

0.03

NDVI range @ 10km [-]

0.05

NDVI range @ 20km [-]

0.06


NDVI slope @ 1 km

3.61469303604e-05

NDVI slope @ 2 km

4.83952773328e-05

NDVI slope @ 5 km

4.47828857379e-05

NDVI slope @ 10 km

2.43886432704e-05

NDVI slope @ 20 km

1.57455908617e-05


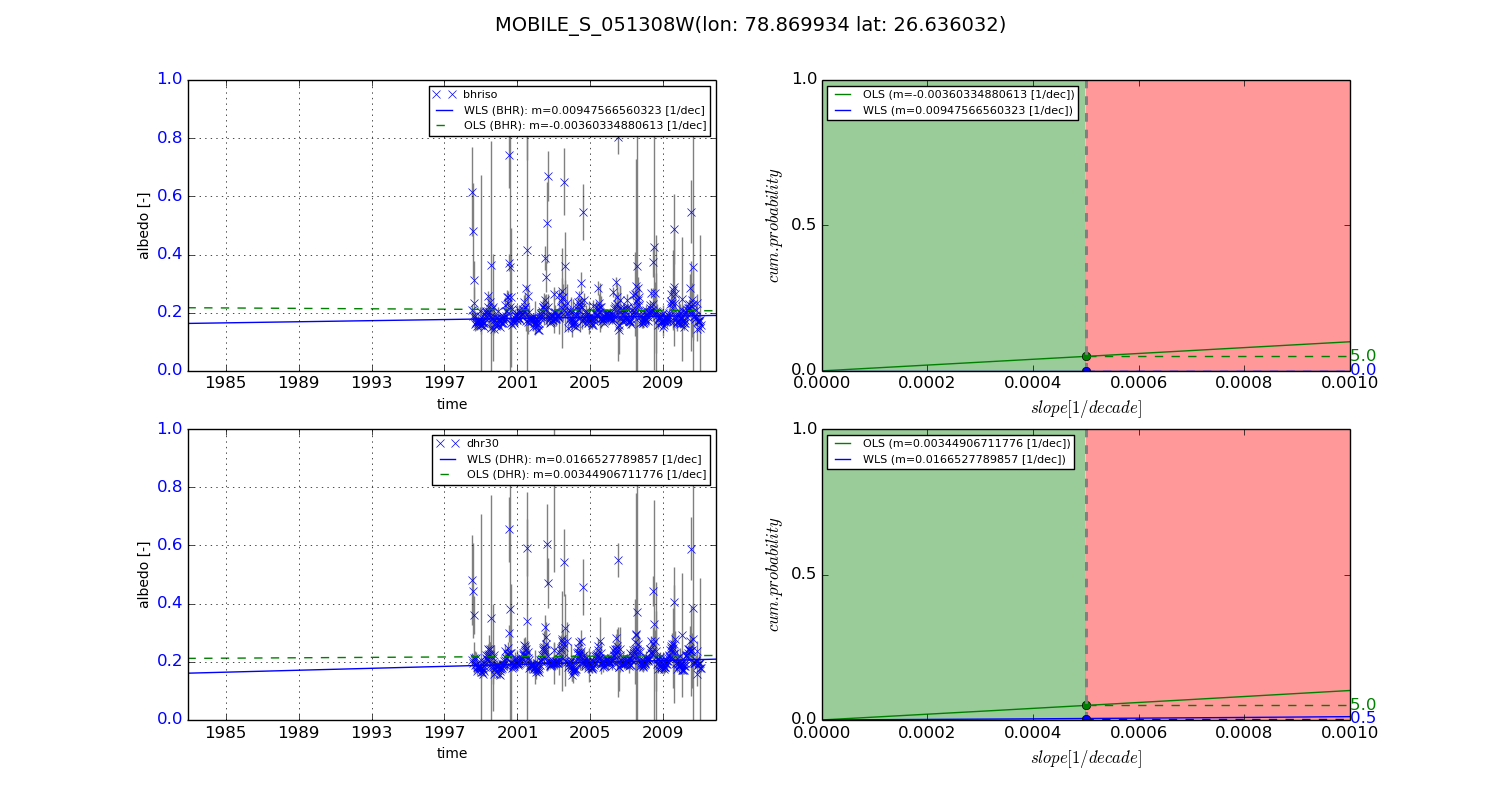
Temporal stability analysis

+000 deg (BHR)


BHR statistics

Temporal stability [1/decade]:


abs

rel


Weighted least square:

-99999.0


Ordinary least square:

-99999.0


Probabilities that GCOS criteria is met:

Weighted least square:

-99999.0 %

Ordinary least square:

-99999.0 %


DHR statistics

Temporal stability [1/decade]:


abs

rel


Weighted least square:

-99999.0


Ordinary least square:

-99999.0


Probabilities that GCOS criteria is met:

Weighted least square:

-99999.0 %

Ordinary least square:

-99999.0 %


+057/+063 deg (BHR)


BHR statistics

Temporal stability [1/decade]:


abs

rel


Weighted least square:

0.00947566560323


Ordinary least square:

-0.00360334880613


Probabilities that GCOS criteria is met:

Weighted least square:

0.0 %

Ordinary least square:

5.0 %


DHR statistics

Temporal stability [1/decade]:


abs

rel


Weighted least square:

0.0166527789857


Ordinary least square:

0.00344906711776


Probabilities that GCOS criteria is met:

Weighted least square:

0.5 %

Ordinary least square:

5.0 %


Temporal anomaly analyis

The variance of the temporal anomalies provides an additional measure about the stability of the signal AFTER removal of the mean seasonal cylce.

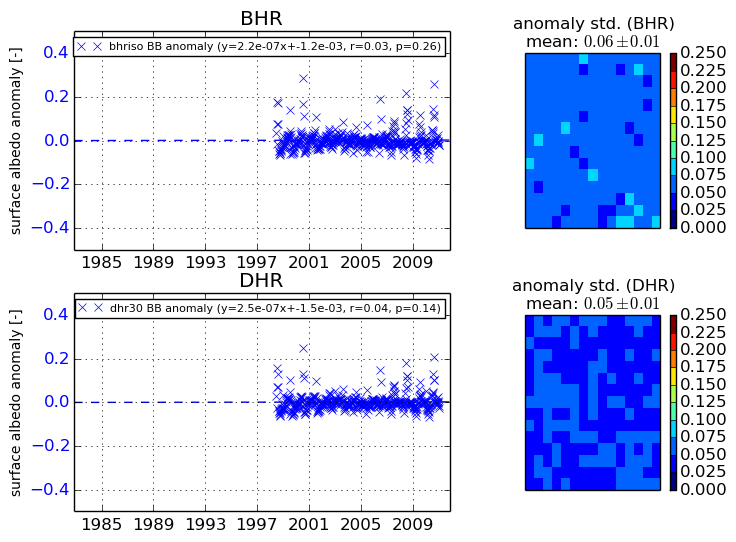
+000 deg


+057/+063 deg