MOBILE_S_052908W


Location

lon / lat [deg]: 78.8989 / 26.6637

Source network: AERONET


Geostationary surface albedo (GSA) data


“+000”


“+057/+063”


Landcover information (based on ESA CCI landcover data)


Landcover fractions @ 2km distance


Landcover fractions @ 20 km distance


Legend


Distance to open water bodies [km]:

3.91

Distance to urban areas [km]:

1.77


Radius: 1 km

Number of landcover classes:

3

Dominant landcover type:

10: cropland, rainfed

Fraction of dominant landcover type [%]:

87.0


Radius: 2 km

Number of landcover classes:

4

Dominant landcover type:

10: cropland, rainfed

Fraction of dominant landcover type [%]:

84.0


Radius: 5 km

Number of landcover classes:

6

Dominant landcover type:

10: cropland, rainfed

Fraction of dominant landcover type [%]:

40.0


Radius: 10 km

Number of landcover classes:

6

Dominant landcover type:

10: cropland, rainfed

Fraction of dominant landcover type [%]:

29.0


Radius: 20 km

Number of landcover classes:

6

Dominant landcover type:

20: cropland, irrigated or post-flooded

Fraction of dominant landcover type [%]:

34.0


Disturbances


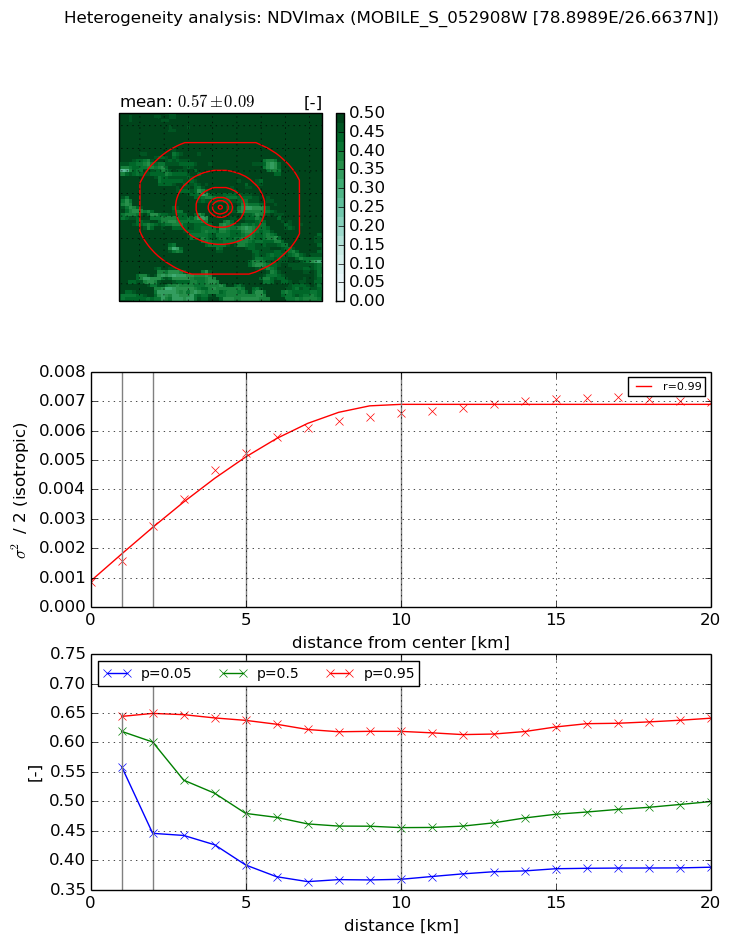
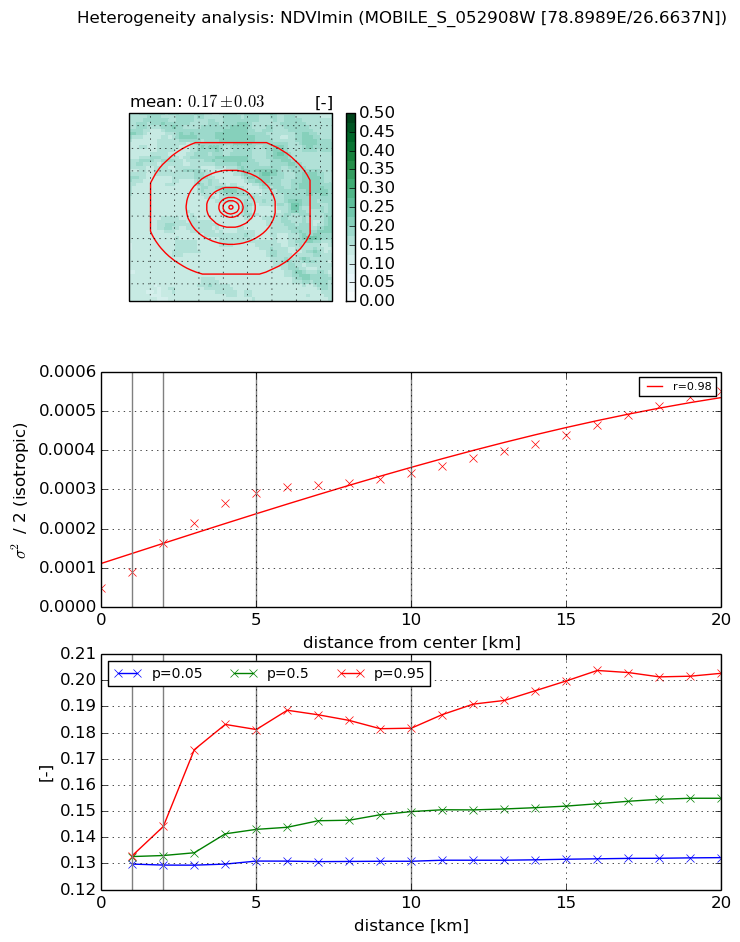
Heterogeneity analysis

The heterogeneity analysis provides information about the spatial and temporal heterogeneity of the site.

Topography


Roman et al. (2009) index


St

1.45682853854e-07

Rcv

1.97558703829

Rse

0.0

Rst

-0.0223461354977

Rsv

20592675.3188


Height range @ 1km [m]

3

Height range @ 2km [m]

4

Height range @ 5km [m]

32

Height range @ 10km [m]

-999

Height range @ 20km [m]

-999


Variance slope @ 1 km

45

Variance slope @ 2 km

35

Variance slope @ 5 km

21

Variance slope @ 10 km

-999

Variance slope @ 20 km

-999


NDVI (max. NDVI composite)


Roman et al. (2009) index


St

7.30501048463

Rcv

0.160201517917

Rse

0.0

Rst

0.0505905636713

Rsv

-0.19988494705


NDVI range @ 1km [-]

0.09

NDVI range @ 2km [-]

0.2

NDVI range @ 5km [-]

0.25

NDVI range @ 10km [-]

0.25

NDVI range @ 20km [-]

0.25


Variance slope @ 1 km

0.000700887205919

Variance slope @ 2 km

0.000950551650754

Variance slope @ 5 km

0.000918146824808

Variance slope @ 10 km

0.000589589232904

Variance slope @ 20 km

0.0002612379755


NDVI (min. NDVI composite)I


Roman et al. (2009) index


St

2.48625135818

Rcv

0.206674143913

Rse

0.0

Rst

-0.000152064426464

Rsv

-0.999809633257


NDVI range @ 1km [-]

0.0

NDVI range @ 2km [-]

0.01

NDVI range @ 5km [-]

0.05

NDVI range @ 10km [-]

0.05

NDVI range @ 20km [-]

0.07


NDVI slope @ 1 km

4.23250539334e-05

NDVI slope @ 2 km

5.74495944588e-05

NDVI slope @ 5 km

5.11897351619e-05

NDVI slope @ 10 km

2.83766008235e-05

NDVI slope @ 20 km

2.15310053015e-05


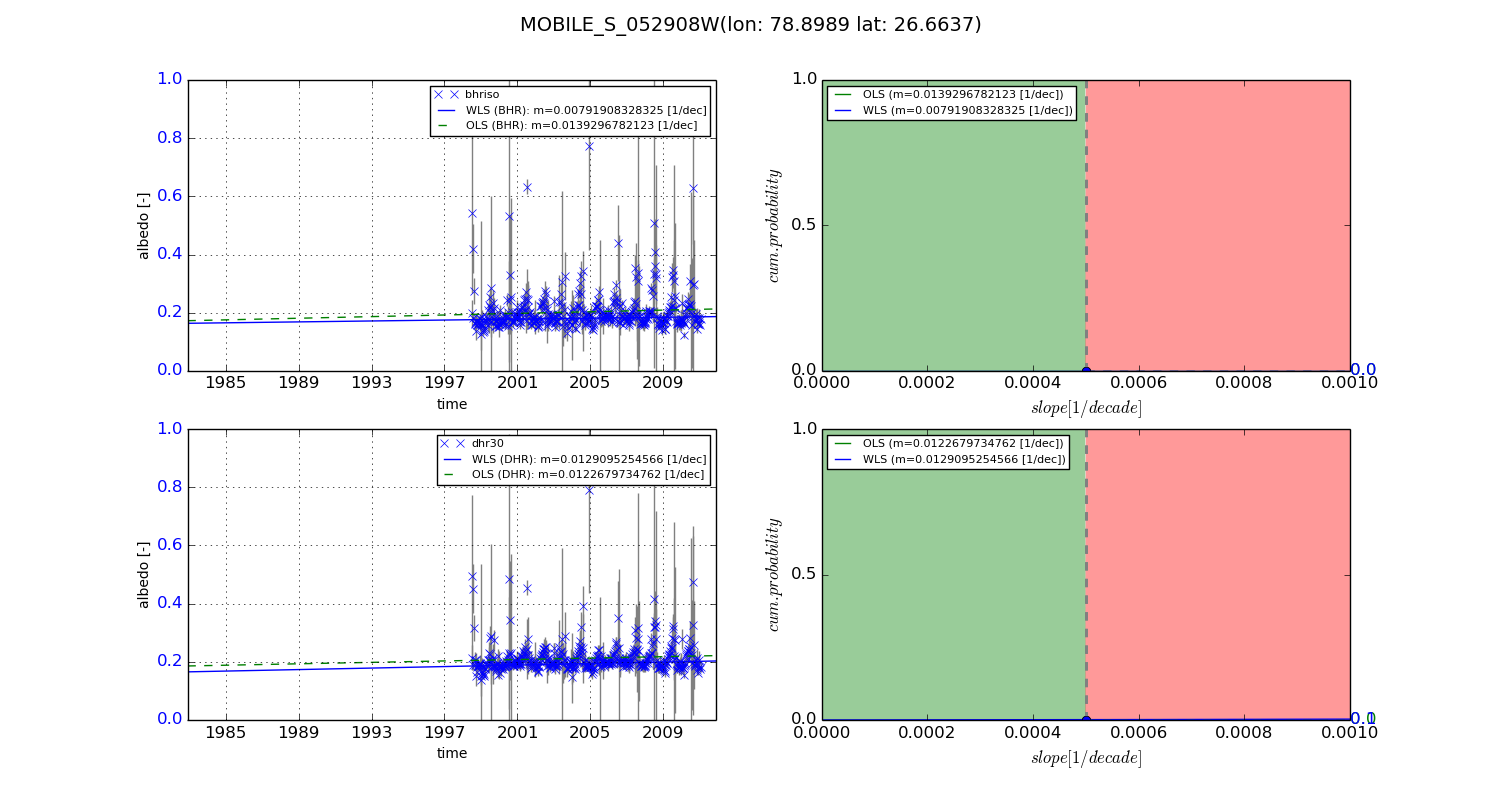
Temporal stability analysis

+000 deg (BHR)


BHR statistics

Temporal stability [1/decade]:


abs

rel


Weighted least square:

-99999.0


Ordinary least square:

-99999.0


Probabilities that GCOS criteria is met:

Weighted least square:

-99999.0 %

Ordinary least square:

-99999.0 %


DHR statistics

Temporal stability [1/decade]:


abs

rel


Weighted least square:

-99999.0


Ordinary least square:

-99999.0


Probabilities that GCOS criteria is met:

Weighted least square:

-99999.0 %

Ordinary least square:

-99999.0 %


+057/+063 deg (BHR)


BHR statistics

Temporal stability [1/decade]:


abs

rel


Weighted least square:

0.00791908328325


Ordinary least square:

0.0139296782123


Probabilities that GCOS criteria is met:

Weighted least square:

0.0 %

Ordinary least square:

0.0 %


DHR statistics

Temporal stability [1/decade]:


abs

rel


Weighted least square:

0.0129095254566


Ordinary least square:

0.0122679734762


Probabilities that GCOS criteria is met:

Weighted least square:

0.1 %

Ordinary least square:

0.0 %


Temporal anomaly analyis

The variance of the temporal anomalies provides an additional measure about the stability of the signal AFTER removal of the mean seasonal cylce.

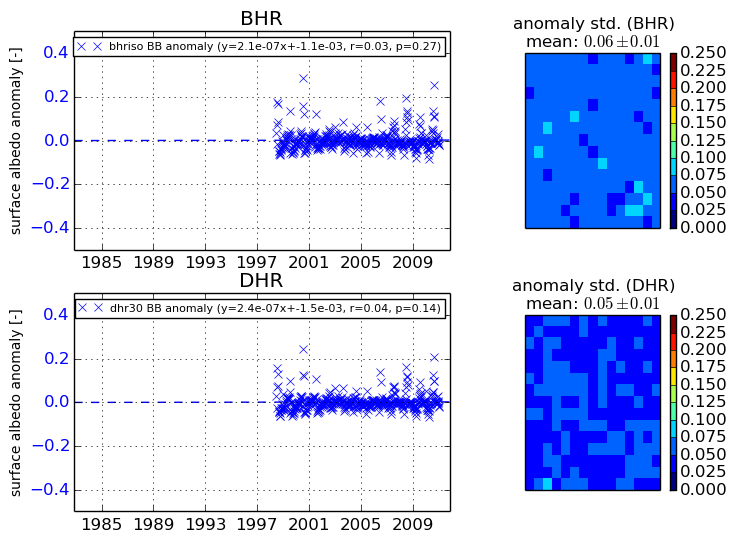
+000 deg


+057/+063 deg