MODENA


Location

lon / lat [deg]: 10.9453 / 44.6317

Source network: AERONET


Geostationary surface albedo (GSA) data


“+000”


“+057/+063”


Landcover information (based on ESA CCI landcover data)


Landcover fractions @ 2km distance


Landcover fractions @ 20 km distance


Legend


Distance to open water bodies [km]:

5.78

Distance to urban areas [km]:

0.05


Radius: 1 km

Number of landcover classes:

1

Dominant landcover type:

190: urban areas

Fraction of dominant landcover type [%]:

100.0


Radius: 2 km

Number of landcover classes:

2

Dominant landcover type:

190: urban areas

Fraction of dominant landcover type [%]:

88.0


Radius: 5 km

Number of landcover classes:

3

Dominant landcover type:

190: urban areas

Fraction of dominant landcover type [%]:

58.0


Radius: 10 km

Number of landcover classes:

3

Dominant landcover type:

10: cropland, rainfed

Fraction of dominant landcover type [%]:

71.0


Radius: 20 km

Number of landcover classes:

3

Dominant landcover type:

10: cropland, rainfed

Fraction of dominant landcover type [%]:

77.0


Disturbances


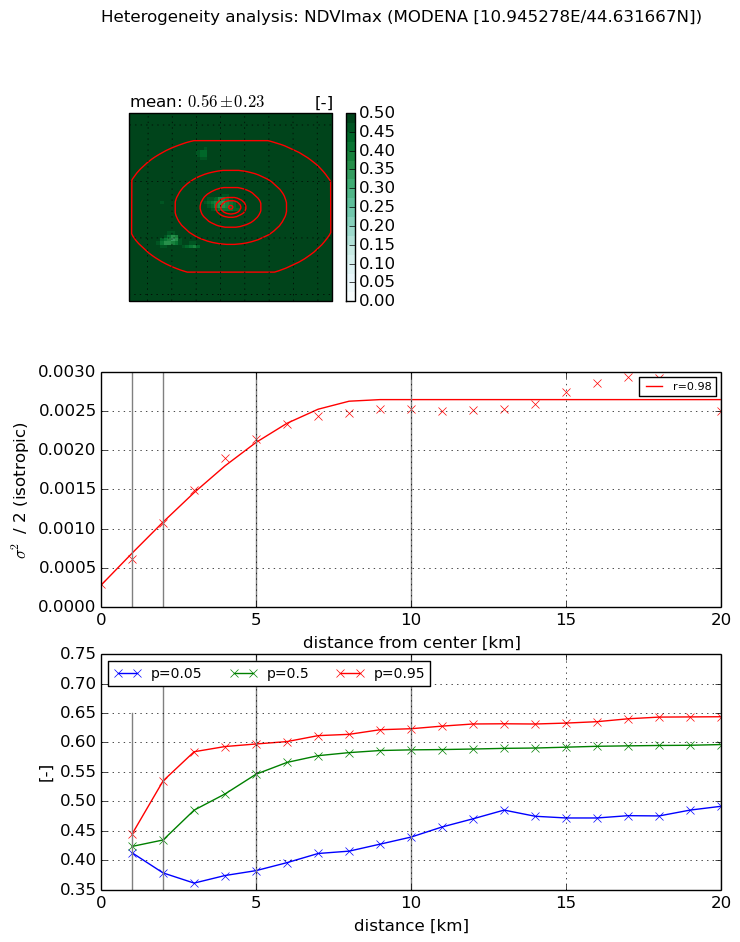
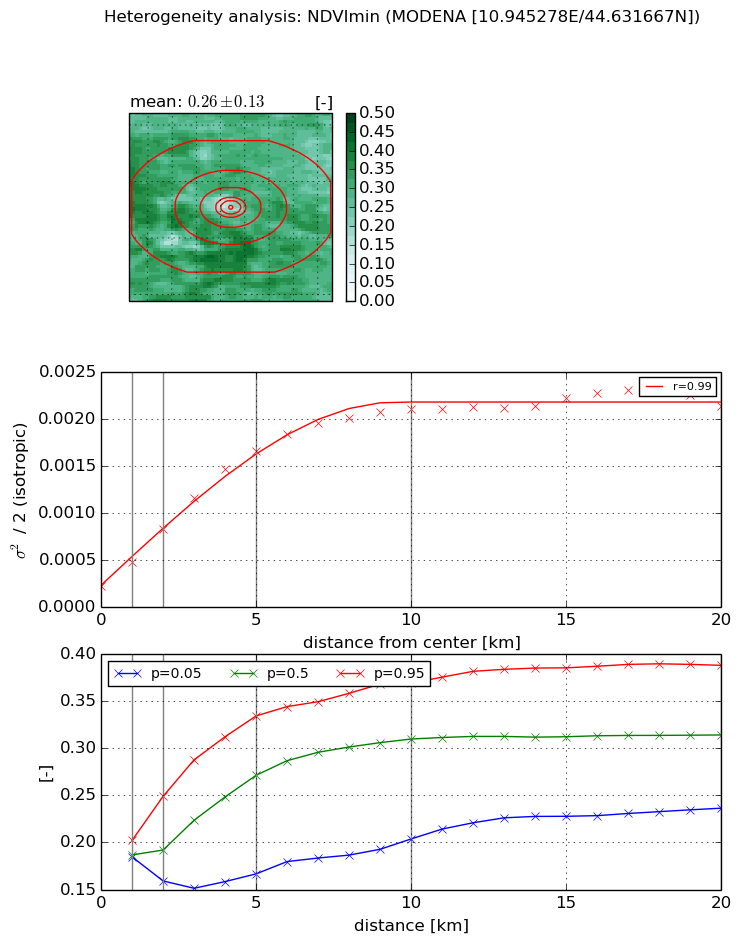
Heterogeneity analysis

The heterogeneity analysis provides information about the spatial and temporal heterogeneity of the site.

Topography


Roman et al. (2009) index


St

3.12243754653

Rcv

0.506076783898

Rse

0.0

Rst

4.63970305221e-09

Rsv

-0.454711043177


Height range @ 1km [m]

6

Height range @ 2km [m]

9

Height range @ 5km [m]

18

Height range @ 10km [m]

-999

Height range @ 20km [m]

-999


Variance slope @ 1 km

4

Variance slope @ 2 km

4

Variance slope @ 5 km

6

Variance slope @ 10 km

-999

Variance slope @ 20 km

-999


NDVI (max. NDVI composite)


Roman et al. (2009) index


St

2.39644774027e-07

Rcv

-0.0563498383407

Rse

0.0

Rst

0.30360008761

Rsv

12518528.4174


NDVI range @ 1km [-]

0.03

NDVI range @ 2km [-]

0.16

NDVI range @ 5km [-]

0.22

NDVI range @ 10km [-]

0.18

NDVI range @ 20km [-]

0.15


Variance slope @ 1 km

0.000323002313322

Variance slope @ 2 km

0.000390482076302

Variance slope @ 5 km

0.000385286246962

Variance slope @ 10 km

0.000230001804518

Variance slope @ 20 km

9.90918286075e-05


NDVI (min. NDVI composite)I


Roman et al. (2009) index


St

8.86566327774e-07

Rcv

0.0507146423708

Rse

0.0

Rst

0.309663428031

Rsv

3383841.21585


NDVI range @ 1km [-]

0.02

NDVI range @ 2km [-]

0.09

NDVI range @ 5km [-]

0.17

NDVI range @ 10km [-]

0.17

NDVI range @ 20km [-]

0.15


NDVI slope @ 1 km

0.000251258392604

NDVI slope @ 2 km

0.000302633865359

NDVI slope @ 5 km

0.000298347159539

NDVI slope @ 10 km

0.000193234546201

NDVI slope @ 20 km

8.3865525651e-05


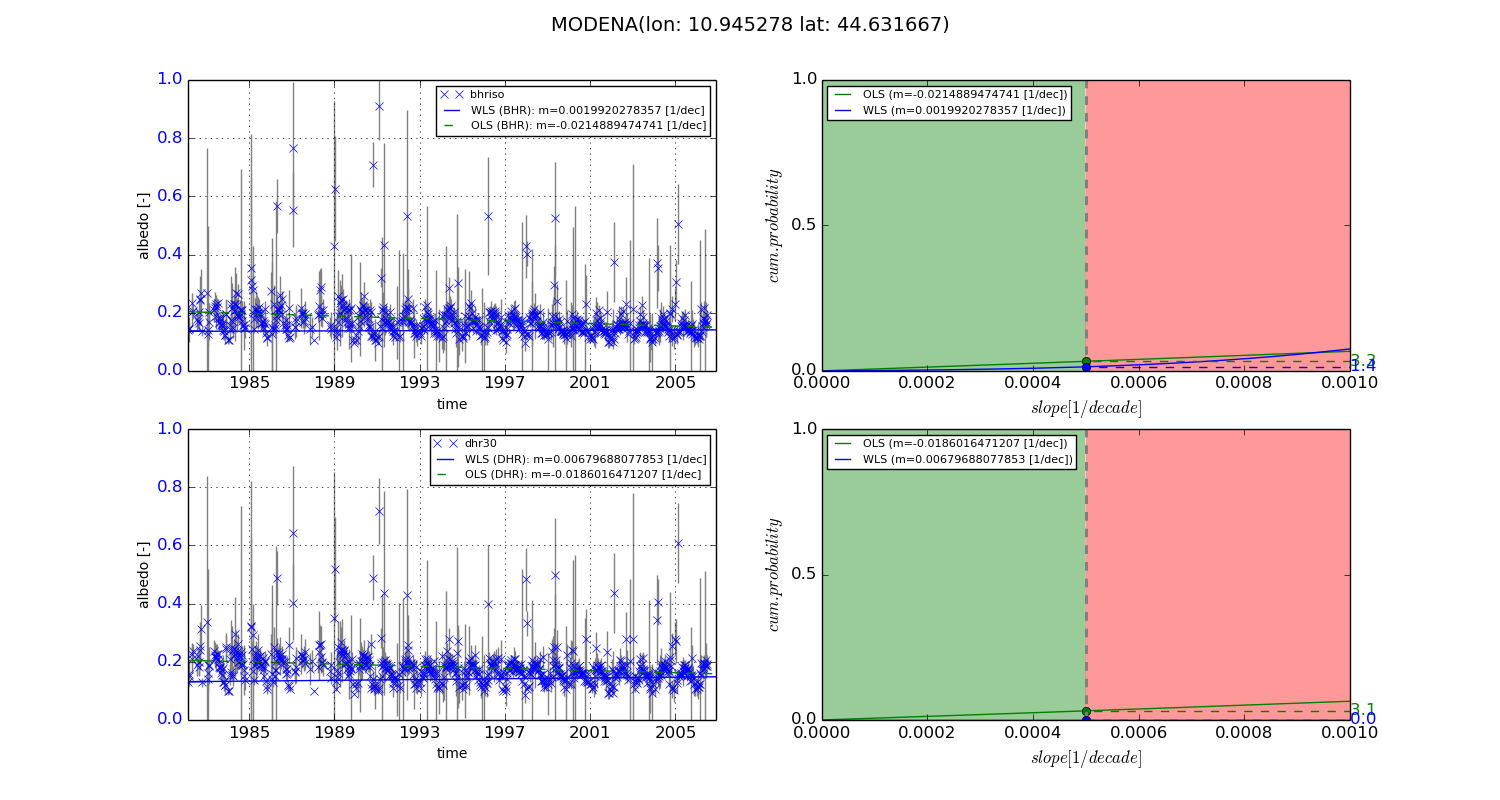
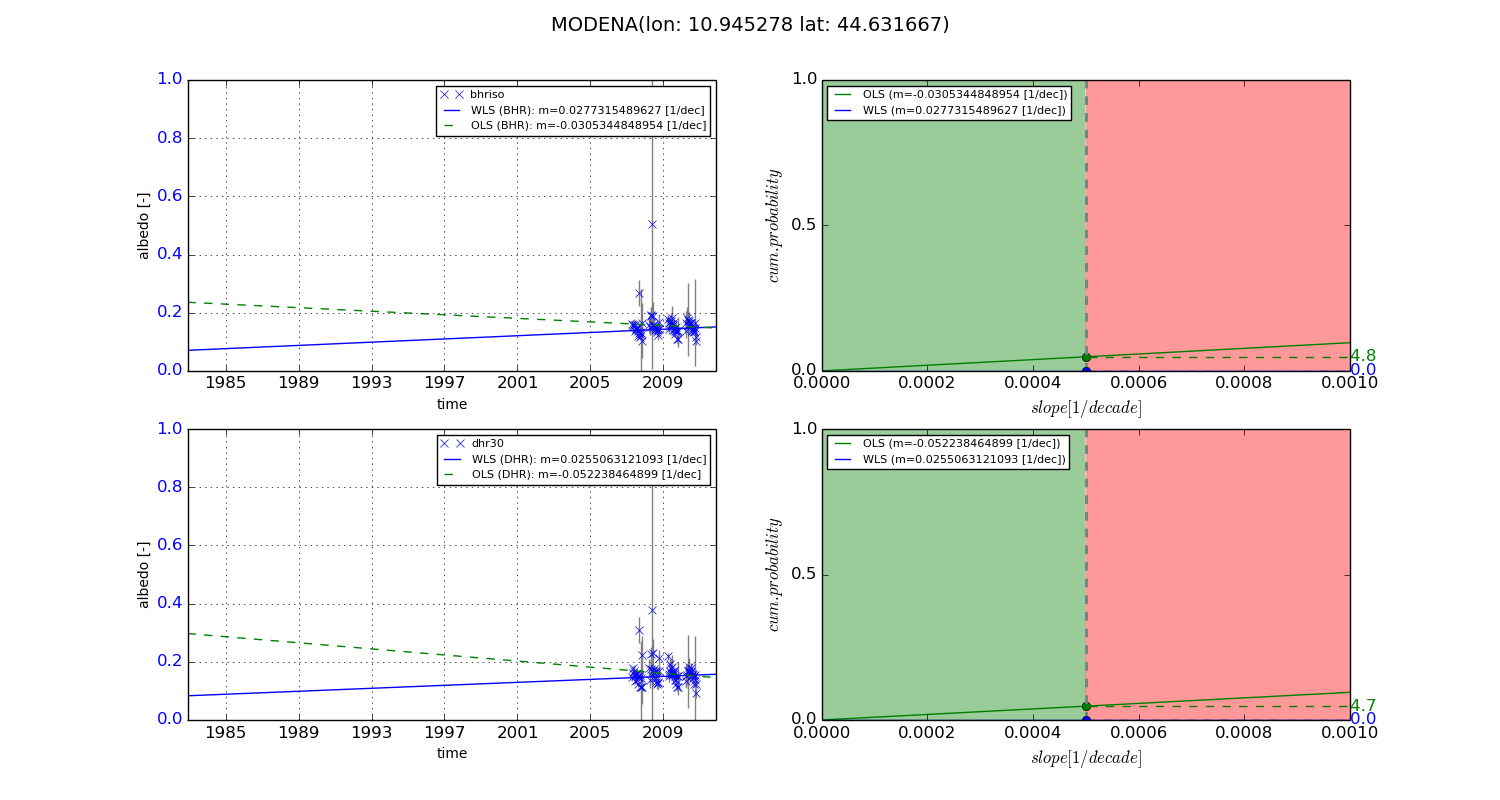
Temporal stability analysis

+000 deg (BHR)


BHR statistics

Temporal stability [1/decade]:


abs

rel


Weighted least square:

0.0019920278357


Ordinary least square:

-0.0214889474741


Probabilities that GCOS criteria is met:

Weighted least square:

1.4 %

Ordinary least square:

3.3 %


DHR statistics

Temporal stability [1/decade]:


abs

rel


Weighted least square:

0.00679688077853


Ordinary least square:

-0.0186016471207


Probabilities that GCOS criteria is met:

Weighted least square:

0.0 %

Ordinary least square:

3.1 %


+057/+063 deg (BHR)


BHR statistics

Temporal stability [1/decade]:


abs

rel


Weighted least square:

0.0277315489627


Ordinary least square:

-0.0305344848954


Probabilities that GCOS criteria is met:

Weighted least square:

0.0 %

Ordinary least square:

4.8 %


DHR statistics

Temporal stability [1/decade]:


abs

rel


Weighted least square:

0.0255063121093


Ordinary least square:

-0.052238464899


Probabilities that GCOS criteria is met:

Weighted least square:

0.0 %

Ordinary least square:

4.7 %


Temporal anomaly analyis

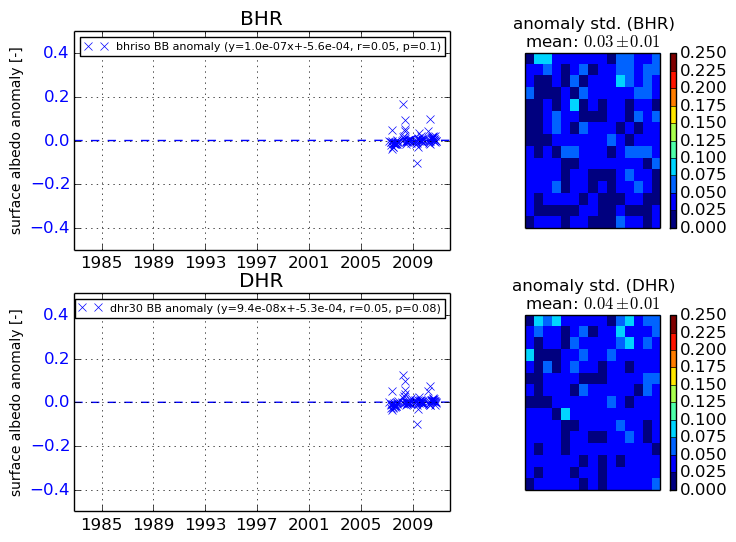
The variance of the temporal anomalies provides an additional measure about the stability of the signal AFTER removal of the mean seasonal cylce.
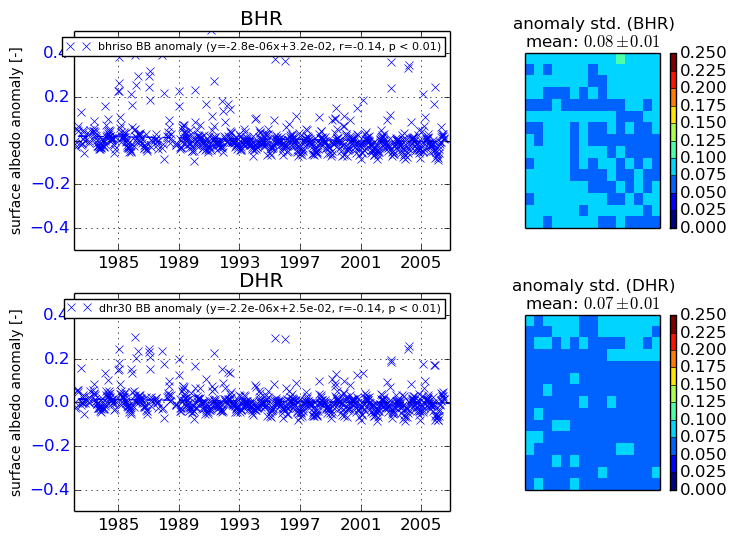
+000 deg


+057/+063 deg