MOLDOVA


Location

lon / lat [deg]: 28.8156 / 47.0001

Source network: AERONET


Geostationary surface albedo (GSA) data


“+000”


“+057/+063”


Landcover information (based on ESA CCI landcover data)


Landcover fractions @ 2km distance


Landcover fractions @ 20 km distance


Legend


Distance to open water bodies [km]:

2.0

Distance to urban areas [km]:

0.15


Radius: 1 km

Number of landcover classes:

1

Dominant landcover type:

190: urban areas

Fraction of dominant landcover type [%]:

100.0


Radius: 2 km

Number of landcover classes:

4

Dominant landcover type:

190: urban areas

Fraction of dominant landcover type [%]:

82.0


Radius: 5 km

Number of landcover classes:

3

Dominant landcover type:

190: urban areas

Fraction of dominant landcover type [%]:

60.0


Radius: 10 km

Number of landcover classes:

4

Dominant landcover type:

10: cropland, rainfed

Fraction of dominant landcover type [%]:

54.0


Radius: 20 km

Number of landcover classes:

5

Dominant landcover type:

10: cropland, rainfed

Fraction of dominant landcover type [%]:

73.0


Disturbances


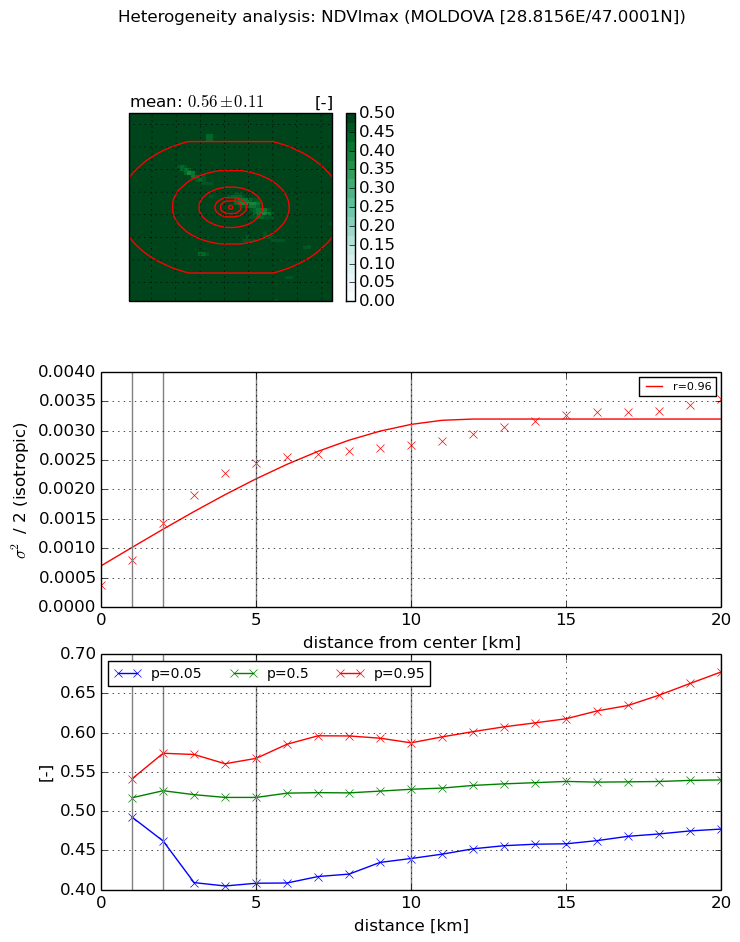
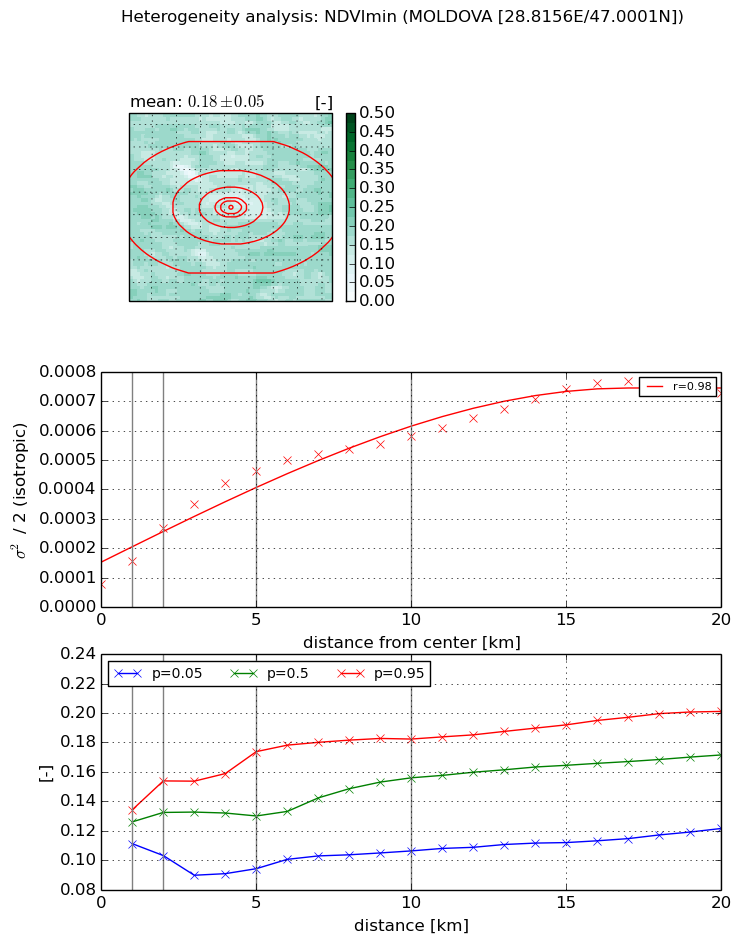
Heterogeneity analysis

The heterogeneity analysis provides information about the spatial and temporal heterogeneity of the site.

Topography


Roman et al. (2009) index


St

4.30999690551

Rcv

0.332676996356

Rse

0.0

Rst

-0.0276988638405

Rsv

-0.335680324012


Height range @ 1km [m]

74

Height range @ 2km [m]

117

Height range @ 5km [m]

162

Height range @ 10km [m]

-999

Height range @ 20km [m]

-999


Variance slope @ 1 km

682

Variance slope @ 2 km

574

Variance slope @ 5 km

520

Variance slope @ 10 km

-999

Variance slope @ 20 km

-999


NDVI (max. NDVI composite)


Roman et al. (2009) index


St

4.47822666064

Rcv

0.0128864925482

Rse

0.0

Rst

-0.140317142367

Rsv

0.516704395057


NDVI range @ 1km [-]

0.05

NDVI range @ 2km [-]

0.11

NDVI range @ 5km [-]

0.16

NDVI range @ 10km [-]

0.15

NDVI range @ 20km [-]

0.2


Variance slope @ 1 km

0.000415003216353

Variance slope @ 2 km

0.000522380041617

Variance slope @ 5 km

0.000435299426745

Variance slope @ 10 km

0.000226054477129

Variance slope @ 20 km

0.000123902360869


NDVI (min. NDVI composite)I


Roman et al. (2009) index


St

4.61836649431

Rcv

0.154261185936

Rse

0.0

Rst

-0.168013227276

Rsv

0.327305909982


NDVI range @ 1km [-]

0.02

NDVI range @ 2km [-]

0.05

NDVI range @ 5km [-]

0.08

NDVI range @ 10km [-]

0.08

NDVI range @ 20km [-]

0.08


NDVI slope @ 1 km

7.71570266321e-05

NDVI slope @ 2 km

9.44475310066e-05

NDVI slope @ 5 km

7.99975000363e-05

NDVI slope @ 10 km

4.85562114836e-05

NDVI slope @ 20 km

3.07073130627e-05


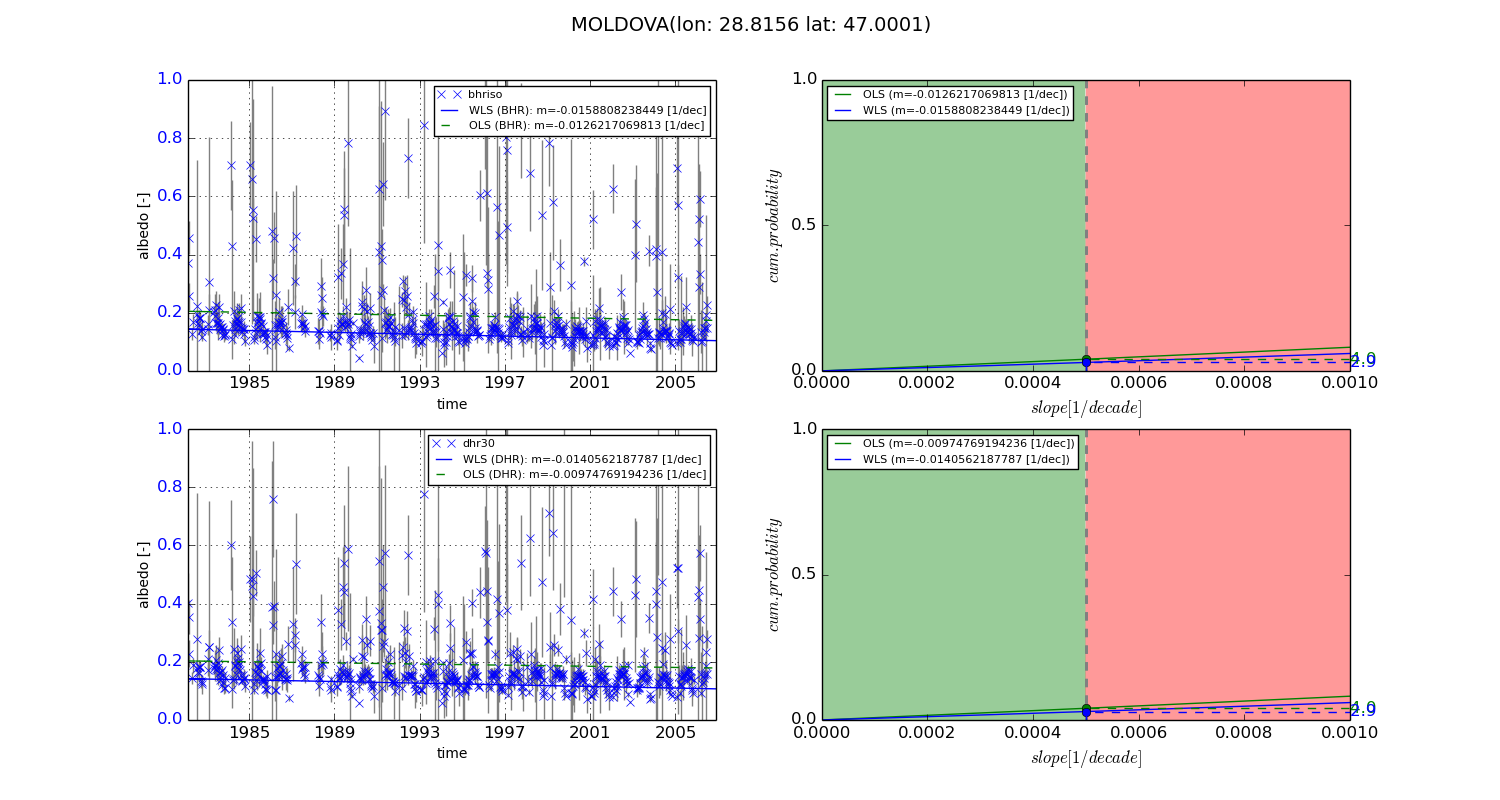
Temporal stability analysis

+000 deg (BHR)


BHR statistics

Temporal stability [1/decade]:


abs

rel


Weighted least square:

-0.0158808238449


Ordinary least square:

-0.0126217069813


Probabilities that GCOS criteria is met:

Weighted least square:

2.9 %

Ordinary least square:

4.0 %


DHR statistics

Temporal stability [1/decade]:


abs

rel


Weighted least square:

-0.0140562187787


Ordinary least square:

-0.00974769194236


Probabilities that GCOS criteria is met:

Weighted least square:

2.9 %

Ordinary least square:

4.0 %


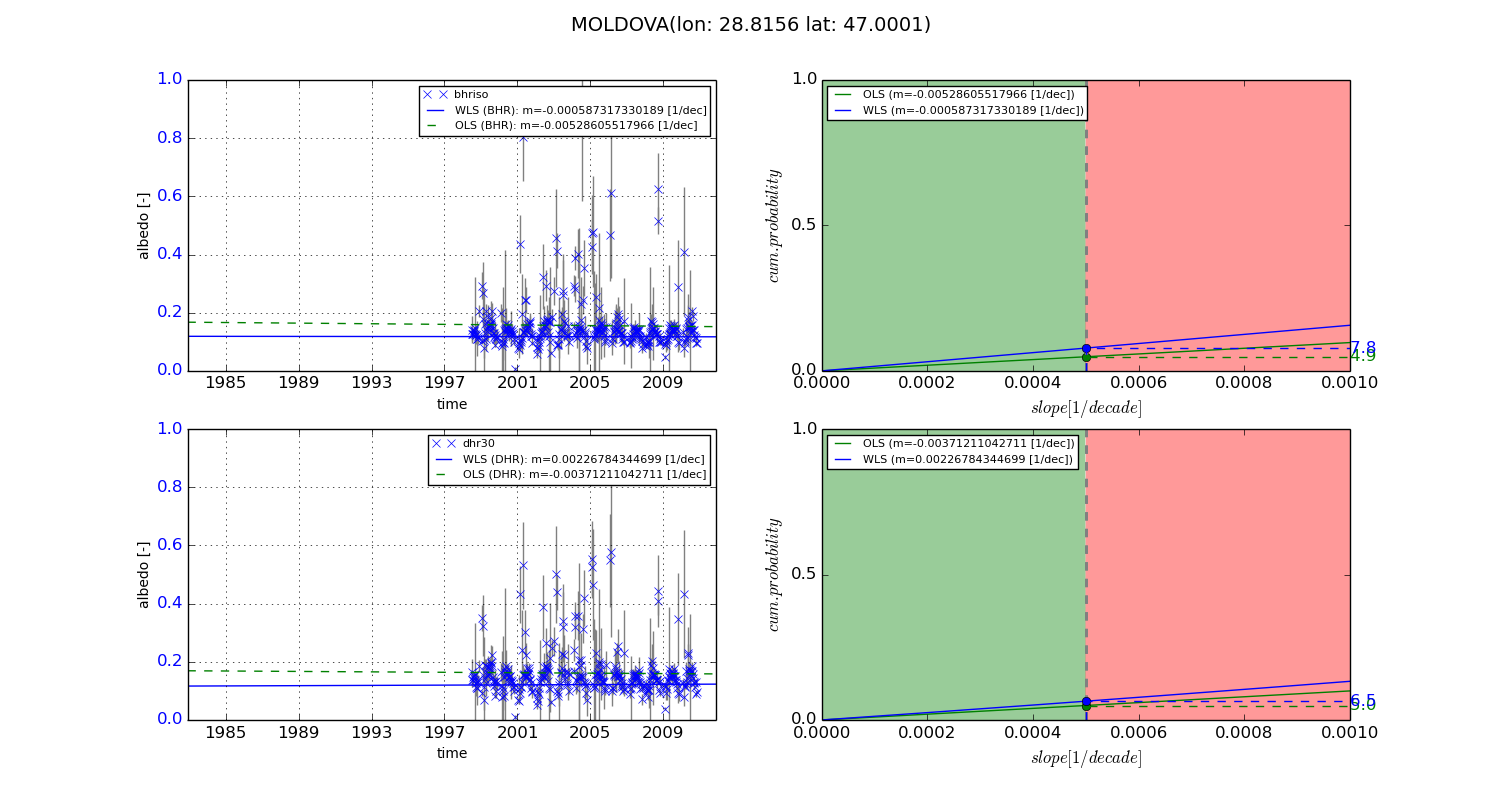
+057/+063 deg (BHR)


BHR statistics

Temporal stability [1/decade]:


abs

rel


Weighted least square:

-0.000587317330189


Ordinary least square:

-0.00528605517966


Probabilities that GCOS criteria is met:

Weighted least square:

7.8 %

Ordinary least square:

4.9 %


DHR statistics

Temporal stability [1/decade]:


abs

rel


Weighted least square:

0.00226784344699


Ordinary least square:

-0.00371211042711


Probabilities that GCOS criteria is met:

Weighted least square:

6.5 %

Ordinary least square:

5.0 %


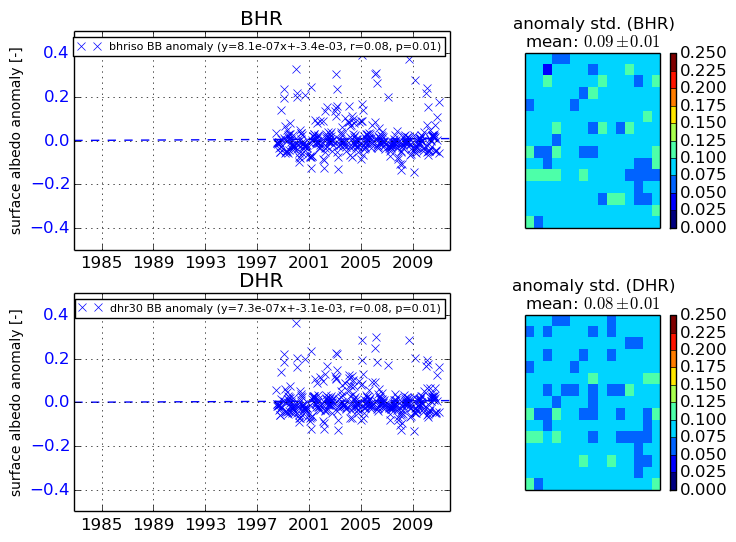
Temporal anomaly analyis

The variance of the temporal anomalies provides an additional measure about the stability of the signal AFTER removal of the mean seasonal cylce.
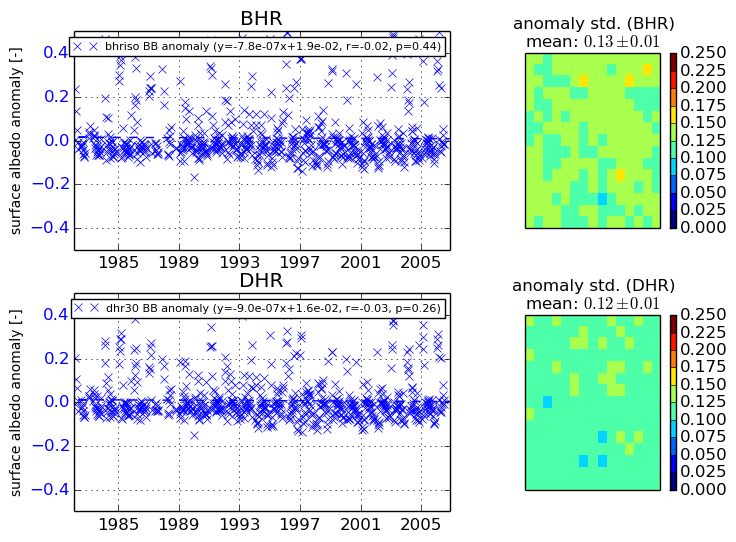
+000 deg


+057/+063 deg