MONGU_INN


Location

lon / lat [deg]: 23.1343 / -15.2667

Source network: AERONET


Geostationary surface albedo (GSA) data


“+000”


“+057/+063”


Landcover information (based on ESA CCI landcover data)


Landcover fractions @ 2km distance


Landcover fractions @ 20 km distance


Legend


Distance to open water bodies [km]:

2.98

Distance to urban areas [km]:

0.47


Radius: 1 km

Number of landcover classes:

4

Dominant landcover type:

130: grassland

Fraction of dominant landcover type [%]:

44.0


Radius: 2 km

Number of landcover classes:

7

Dominant landcover type:

190: urban areas

Fraction of dominant landcover type [%]:

45.0


Radius: 5 km

Number of landcover classes:

8

Dominant landcover type:

180: shrub or herbaceous cover, flooded, fresh/saline/brakish water

Fraction of dominant landcover type [%]:

29.0


Radius: 10 km

Number of landcover classes:

9

Dominant landcover type:

180: shrub or herbaceous cover, flooded, fresh/saline/brakish water

Fraction of dominant landcover type [%]:

32.0


Radius: 20 km

Number of landcover classes:

10

Dominant landcover type:

180: shrub or herbaceous cover, flooded, fresh/saline/brakish water

Fraction of dominant landcover type [%]:

39.0


Disturbances


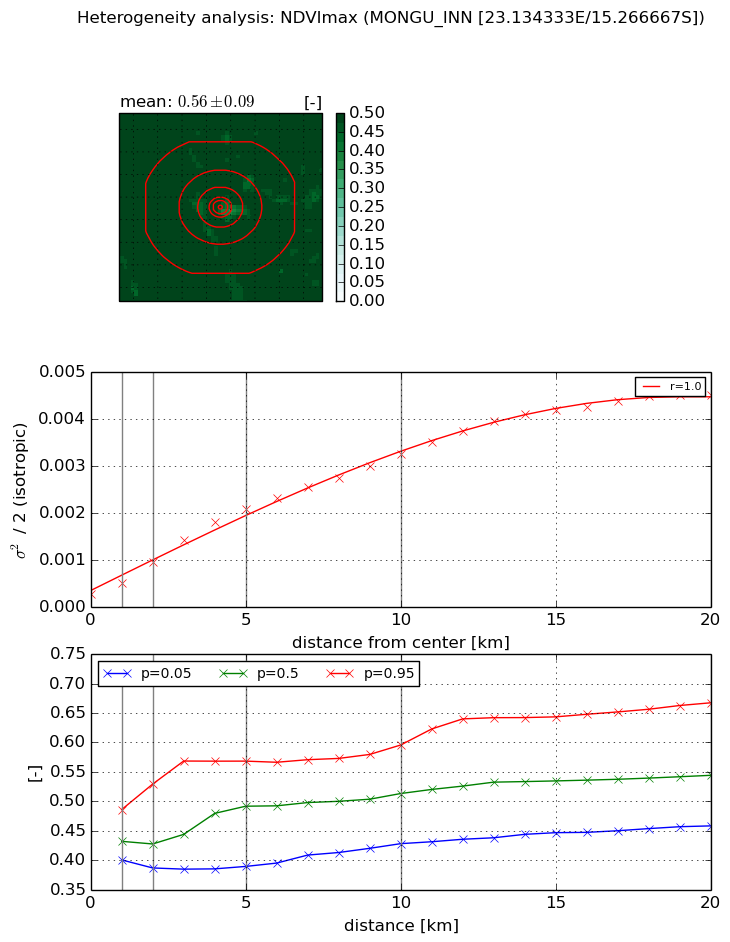
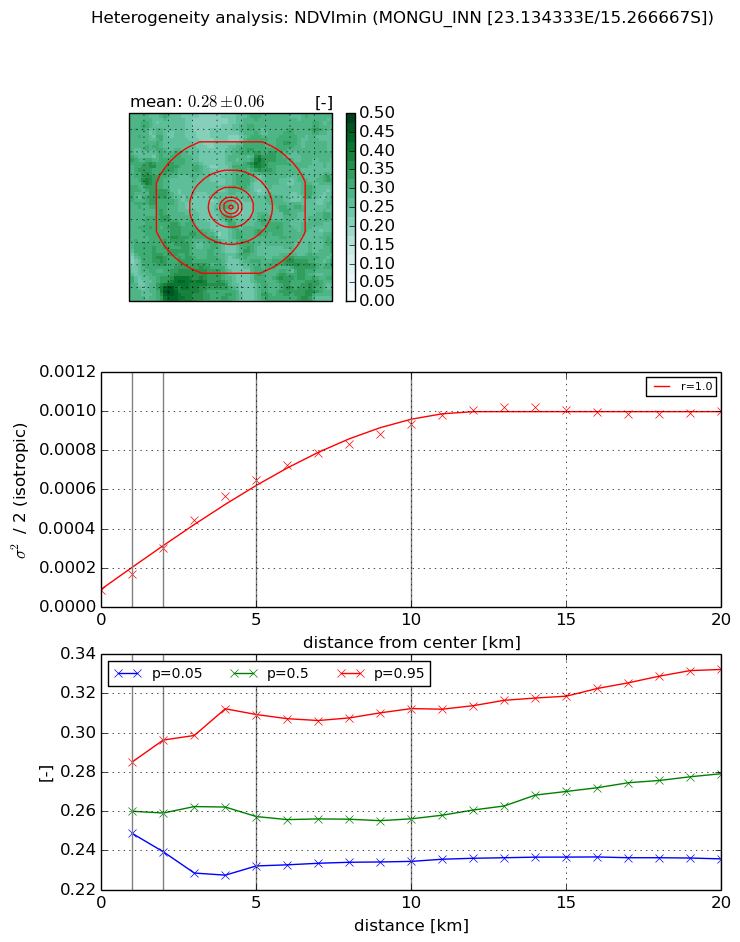
Heterogeneity analysis

The heterogeneity analysis provides information about the spatial and temporal heterogeneity of the site.

Topography


Roman et al. (2009) index


St

2.39219775371

Rcv

0.283734699639

Rse

0.0

Rst

-1.59676962799e-06

Rsv

-0.970340627354


Height range @ 1km [m]

39

Height range @ 2km [m]

43

Height range @ 5km [m]

60

Height range @ 10km [m]

-999

Height range @ 20km [m]

-999


Variance slope @ 1 km

83

Variance slope @ 2 km

92

Variance slope @ 5 km

112

Variance slope @ 10 km

-999

Variance slope @ 20 km

-999


NDVI (max. NDVI composite)


Roman et al. (2009) index


St

4.48710385936

Rcv

-0.136902406582

Rse

0.0

Rst

0.422005667748

Rsv

-0.109674622667


NDVI range @ 1km [-]

0.09

NDVI range @ 2km [-]

0.14

NDVI range @ 5km [-]

0.18

NDVI range @ 10km [-]

0.17

NDVI range @ 20km [-]

0.21


Variance slope @ 1 km

0.00025266117838

Variance slope @ 2 km

0.000346945857698

Variance slope @ 5 km

0.000384009897913

Variance slope @ 10 km

0.000299132099129

Variance slope @ 20 km

0.000215526757546


NDVI (min. NDVI composite)I


Roman et al. (2009) index


St

4.30893467082

Rcv

0.00444126901382

Rse

0.0

Rst

0.315121989023

Rsv

-0.376664517314


NDVI range @ 1km [-]

0.04

NDVI range @ 2km [-]

0.06

NDVI range @ 5km [-]

0.08

NDVI range @ 10km [-]

0.08

NDVI range @ 20km [-]

0.1


NDVI slope @ 1 km

8.02897723058e-05

NDVI slope @ 2 km

0.000107851215364

NDVI slope @ 5 km

0.000118631547176

NDVI slope @ 10 km

8.66778781707e-05

NDVI slope @ 20 km

4.21909028948e-05


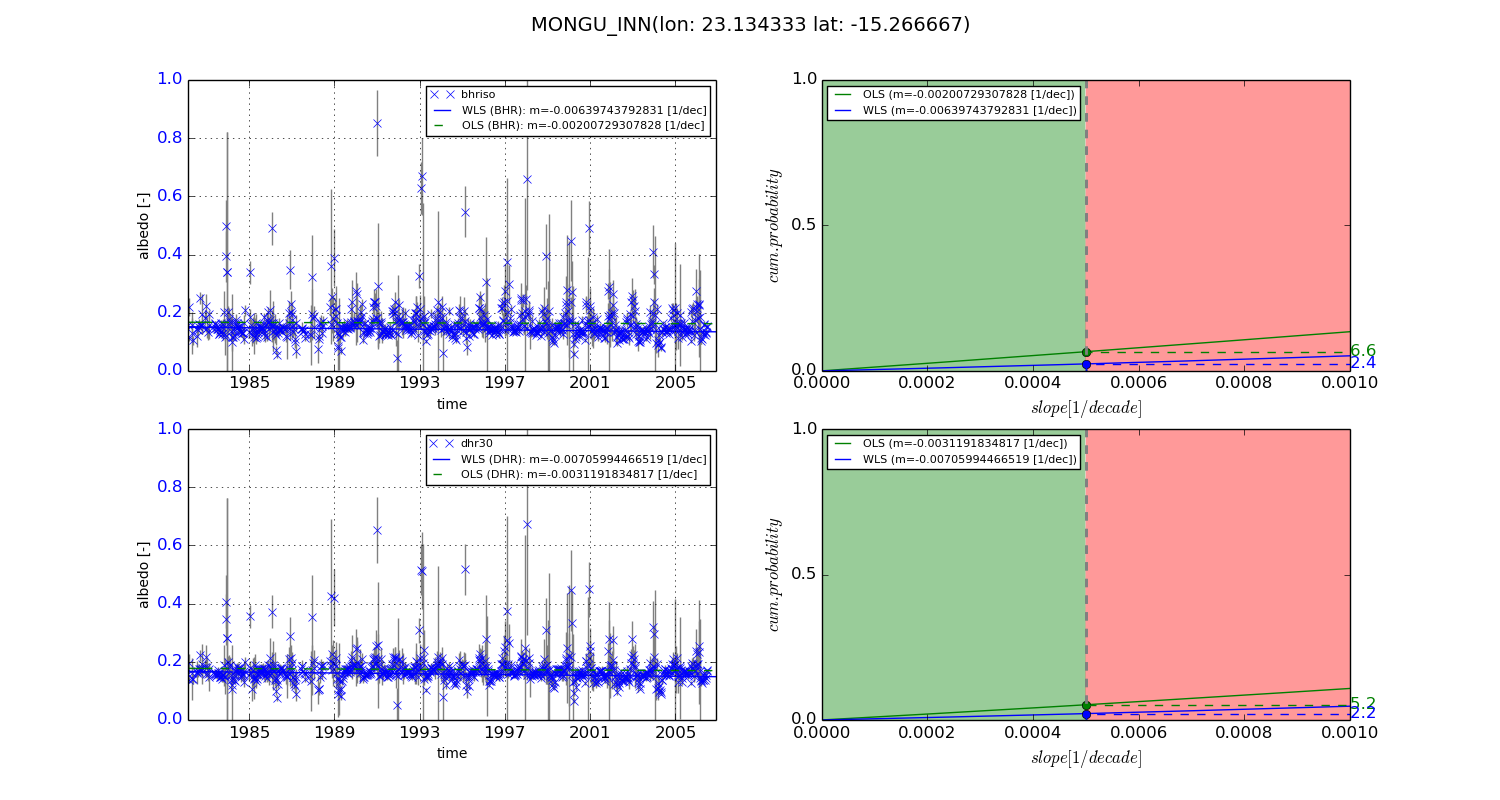
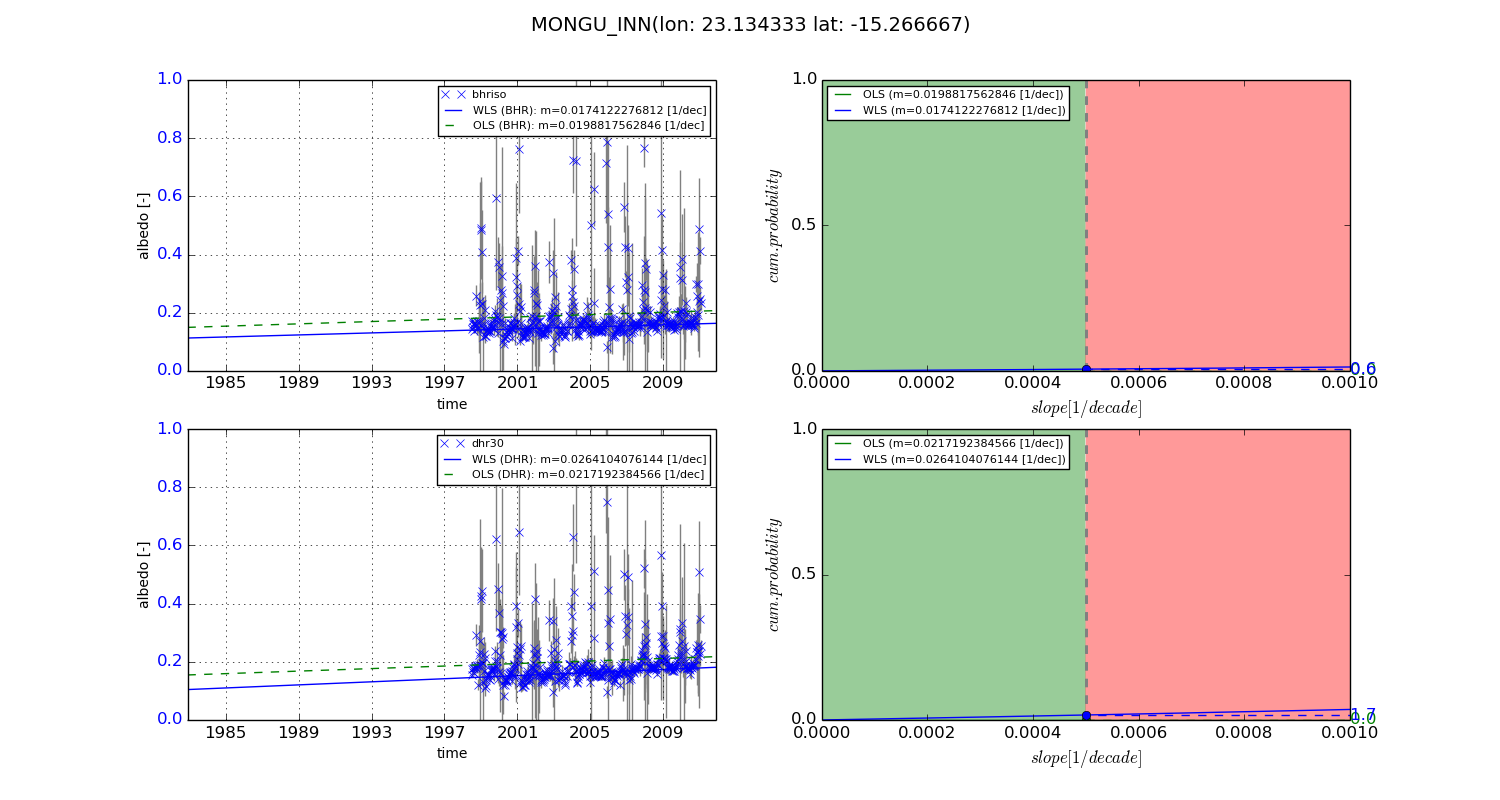
Temporal stability analysis

+000 deg (BHR)


BHR statistics

Temporal stability [1/decade]:


abs

rel


Weighted least square:

-0.00639743792831


Ordinary least square:

-0.00200729307828


Probabilities that GCOS criteria is met:

Weighted least square:

2.4 %

Ordinary least square:

6.6 %


DHR statistics

Temporal stability [1/decade]:


abs

rel


Weighted least square:

-0.00705994466519


Ordinary least square:

-0.0031191834817


Probabilities that GCOS criteria is met:

Weighted least square:

2.2 %

Ordinary least square:

5.2 %


+057/+063 deg (BHR)


BHR statistics

Temporal stability [1/decade]:


abs

rel


Weighted least square:

0.0174122276812


Ordinary least square:

0.0198817562846


Probabilities that GCOS criteria is met:

Weighted least square:

0.6 %

Ordinary least square:

0.0 %


DHR statistics

Temporal stability [1/decade]:


abs

rel


Weighted least square:

0.0264104076144


Ordinary least square:

0.0217192384566


Probabilities that GCOS criteria is met:

Weighted least square:

1.7 %

Ordinary least square:

0.0 %


Temporal anomaly analyis

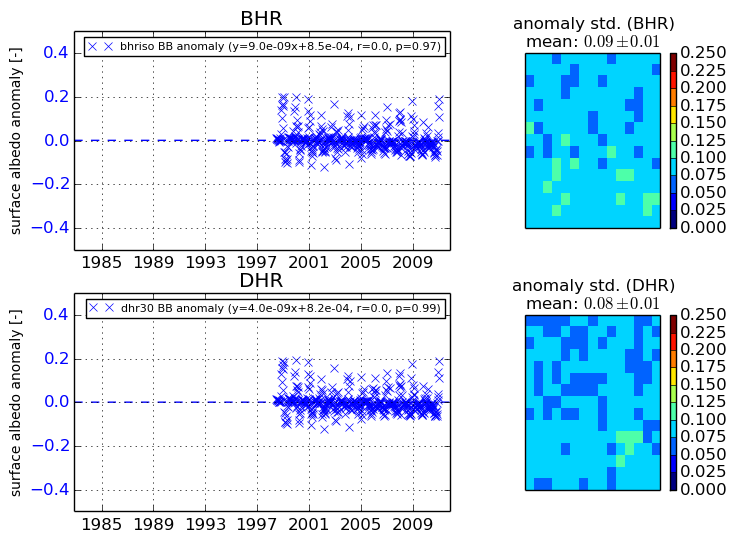
The variance of the temporal anomalies provides an additional measure about the stability of the signal AFTER removal of the mean seasonal cylce.
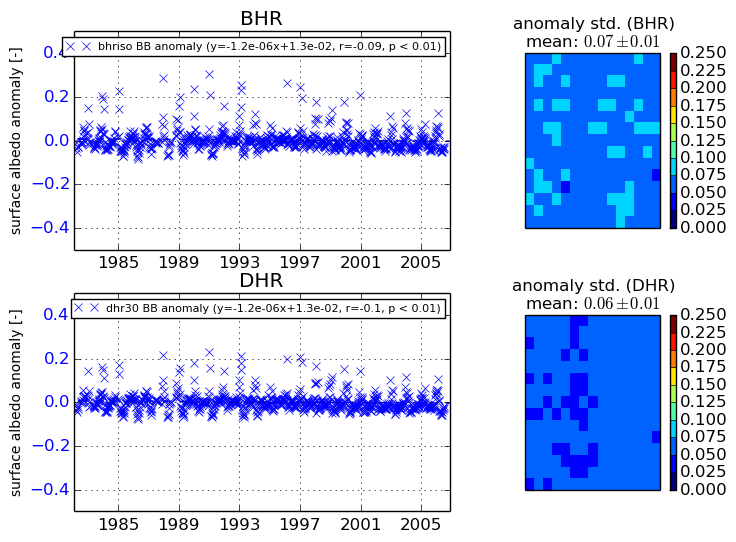
+000 deg


+057/+063 deg