MONKS_WOOD


Location

lon / lat [deg]: -0.2352 / 52.4022

Source network: AERONET


Geostationary surface albedo (GSA) data


“+000”


“+057/+063”


Landcover information (based on ESA CCI landcover data)


Landcover fractions @ 2km distance


Landcover fractions @ 20 km distance


Legend


Distance to open water bodies [km]:

6.6

Distance to urban areas [km]:

1.96


Radius: 1 km

Number of landcover classes:

5

Dominant landcover type:

10: cropland, rainfed

Fraction of dominant landcover type [%]:

53.0


Radius: 2 km

Number of landcover classes:

4

Dominant landcover type:

10: cropland, rainfed

Fraction of dominant landcover type [%]:

85.0


Radius: 5 km

Number of landcover classes:

4

Dominant landcover type:

10: cropland, rainfed

Fraction of dominant landcover type [%]:

86.0


Radius: 10 km

Number of landcover classes:

3

Dominant landcover type:

10: cropland, rainfed

Fraction of dominant landcover type [%]:

86.0


Radius: 20 km

Number of landcover classes:

4

Dominant landcover type:

10: cropland, rainfed

Fraction of dominant landcover type [%]:

84.0


Disturbances


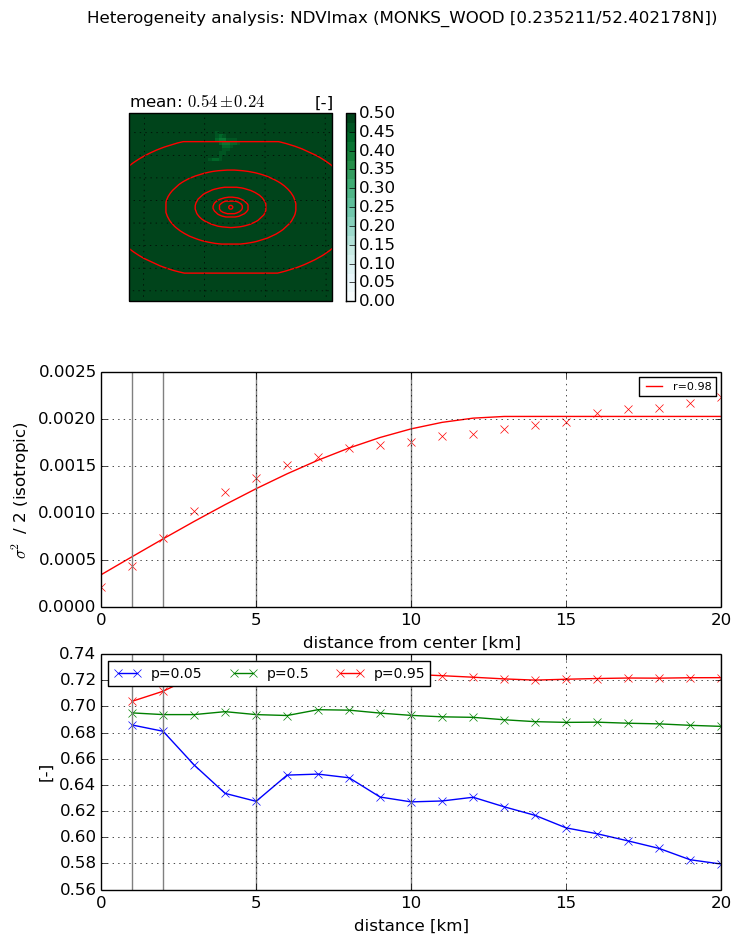
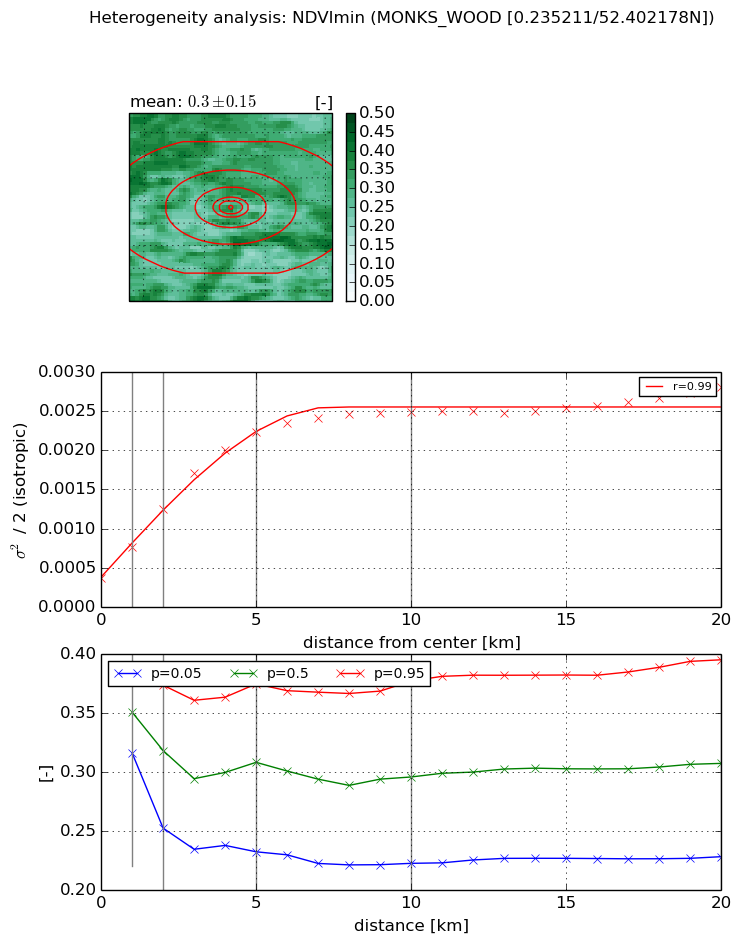
Heterogeneity analysis

The heterogeneity analysis provides information about the spatial and temporal heterogeneity of the site.

Topography


Roman et al. (2009) index


St

6.08986695121

Rcv

0.273414204125

Rse

0.0

Rst

-0.0519743047223

Rsv

-0.16723309094


Height range @ 1km [m]

34

Height range @ 2km [m]

41

Height range @ 5km [m]

48

Height range @ 10km [m]

-999

Height range @ 20km [m]

-999


Variance slope @ 1 km

55

Variance slope @ 2 km

67

Variance slope @ 5 km

65

Variance slope @ 10 km

-999

Variance slope @ 20 km

-999


NDVI (max. NDVI composite)


Roman et al. (2009) index


St

1.92920419662e-07

Rcv

0.408206092929

Rse

0.0

Rst

0.128317797512

Rsv

15550452.8849


NDVI range @ 1km [-]

0.02

NDVI range @ 2km [-]

0.03

NDVI range @ 5km [-]

0.1

NDVI range @ 10km [-]

0.1

NDVI range @ 20km [-]

0.14


Variance slope @ 1 km

0.000228455377741

Variance slope @ 2 km

0.000260425550233

Variance slope @ 5 km

0.000241110157195

Variance slope @ 10 km

0.000155858271699

Variance slope @ 20 km

8.49565926168e-05


NDVI (min. NDVI composite)I


Roman et al. (2009) index


St

8.26021393536

Rcv

0.0926852809177

Rse

0.0

Rst

-0.0635504873922

Rsv

0.206950951002


NDVI range @ 1km [-]

0.06

NDVI range @ 2km [-]

0.12

NDVI range @ 5km [-]

0.14

NDVI range @ 10km [-]

0.15

NDVI range @ 20km [-]

0.17


NDVI slope @ 1 km

0.00038802266617

NDVI slope @ 2 km

0.000438199028638

NDVI slope @ 5 km

0.000384650722253

NDVI slope @ 10 km

0.000206850594547

NDVI slope @ 20 km

8.49438103174e-05


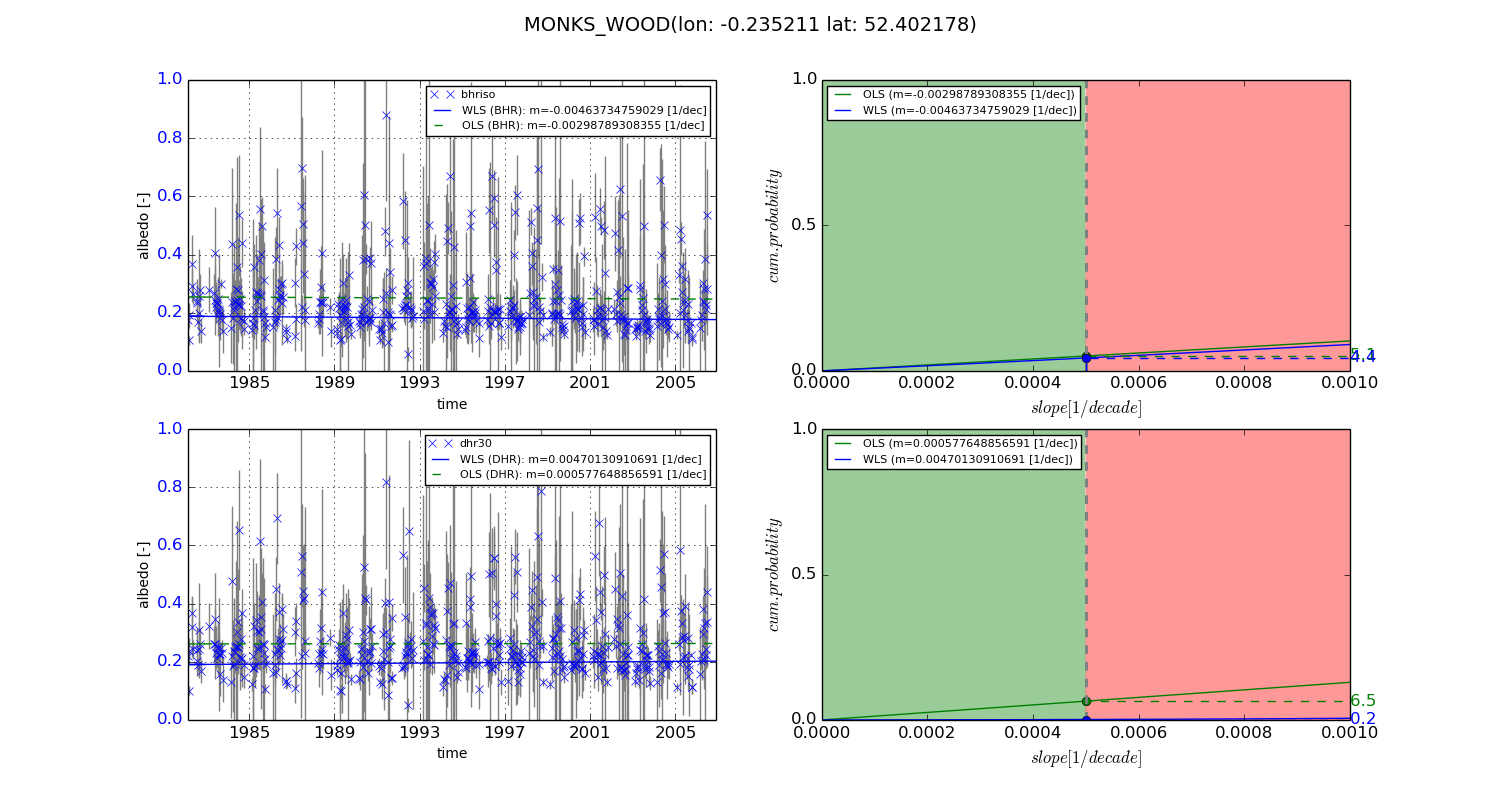
Temporal stability analysis

+000 deg (BHR)


BHR statistics

Temporal stability [1/decade]:


abs

rel


Weighted least square:

-0.00463734759029


Ordinary least square:

-0.00298789308355


Probabilities that GCOS criteria is met:

Weighted least square:

4.4 %

Ordinary least square:

5.1 %


DHR statistics

Temporal stability [1/decade]:


abs

rel


Weighted least square:

0.00470130910691


Ordinary least square:

0.000577648856591


Probabilities that GCOS criteria is met:

Weighted least square:

0.2 %

Ordinary least square:

6.5 %


+057/+063 deg (BHR)


BHR statistics

Temporal stability [1/decade]:


abs

rel


Weighted least square:

-99999.0


Ordinary least square:

-99999.0


Probabilities that GCOS criteria is met:

Weighted least square:

-99999.0 %

Ordinary least square:

-99999.0 %


DHR statistics

Temporal stability [1/decade]:


abs

rel


Weighted least square:

-99999.0


Ordinary least square:

-99999.0


Probabilities that GCOS criteria is met:

Weighted least square:

-99999.0 %

Ordinary least square:

-99999.0 %


Temporal anomaly analyis

The variance of the temporal anomalies provides an additional measure about the stability of the signal AFTER removal of the mean seasonal cylce.
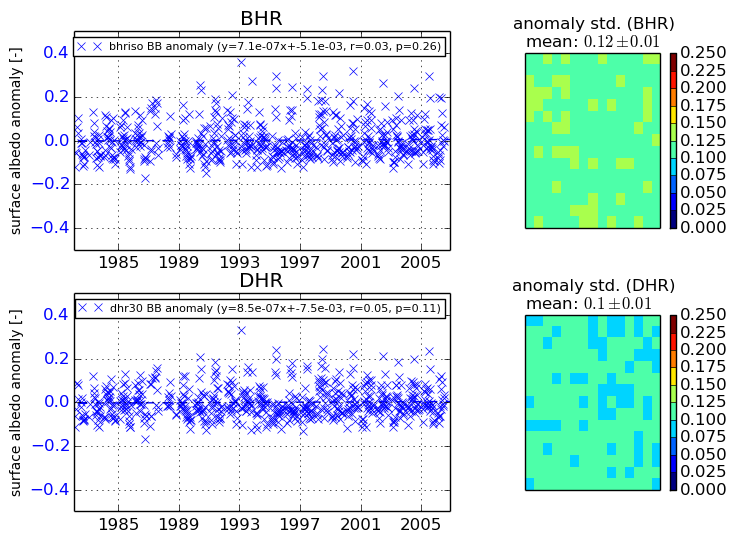
+000 deg


+057/+063 deg