MONTSEC


Location

lon / lat [deg]: 0.7297 / 42.0514

Source network: AERONET


Geostationary surface albedo (GSA) data


“+000”


“+057/+063”


Landcover information (based on ESA CCI landcover data)


Landcover fractions @ 2km distance


Landcover fractions @ 20 km distance


Legend


Distance to open water bodies [km]:

4.51

Distance to urban areas [km]:

6.11


Radius: 1 km

Number of landcover classes:

5

Dominant landcover type:

10: cropland, rainfed

Fraction of dominant landcover type [%]:

49.0


Radius: 2 km

Number of landcover classes:

5

Dominant landcover type:

10: cropland, rainfed

Fraction of dominant landcover type [%]:

52.0


Radius: 5 km

Number of landcover classes:

5

Dominant landcover type:

10: cropland, rainfed

Fraction of dominant landcover type [%]:

55.0


Radius: 10 km

Number of landcover classes:

7

Dominant landcover type:

10: cropland, rainfed

Fraction of dominant landcover type [%]:

60.0


Radius: 20 km

Number of landcover classes:

7

Dominant landcover type:

10: cropland, rainfed

Fraction of dominant landcover type [%]:

58.0


Disturbances


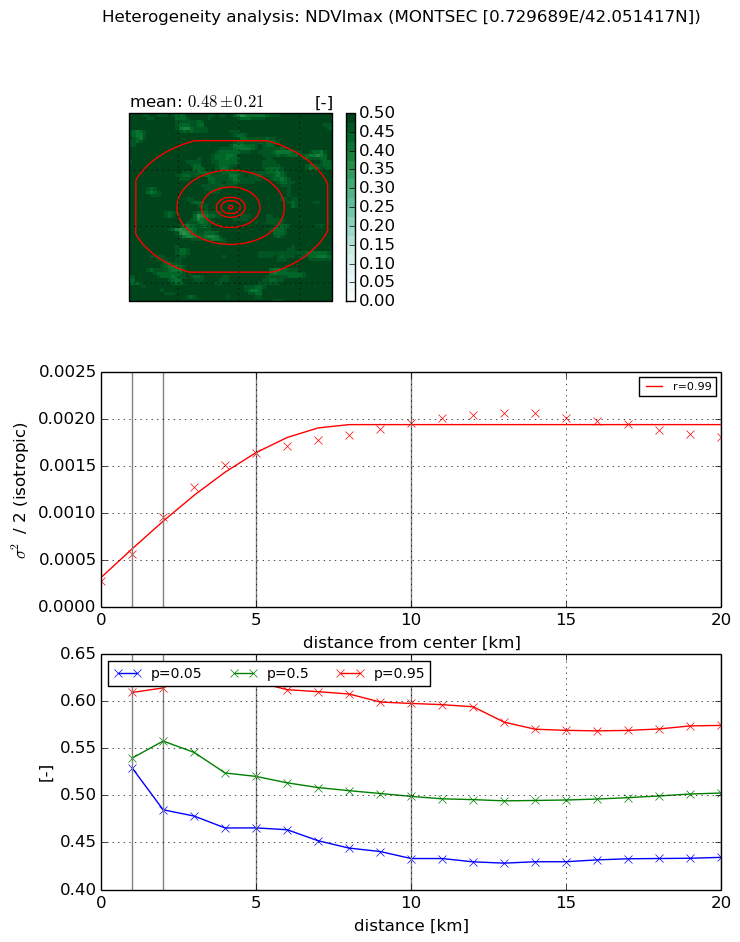
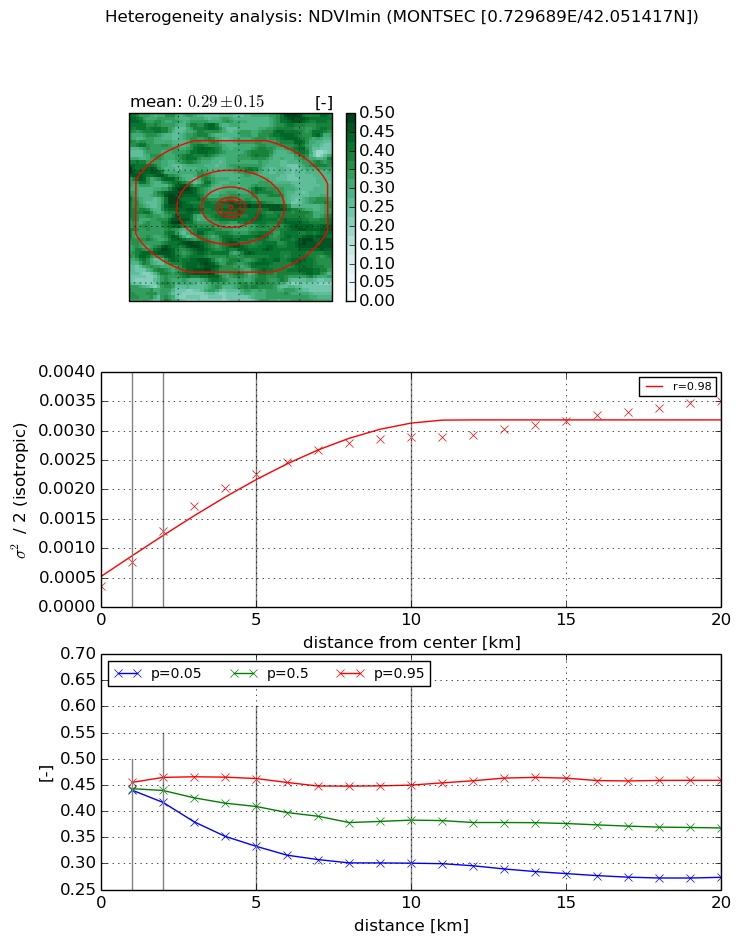
Heterogeneity analysis

The heterogeneity analysis provides information about the spatial and temporal heterogeneity of the site.

Topography


Roman et al. (2009) index


St

1.80148009518

Rcv

0.757491929034

Rse

0.0

Rst

-0.015262460715

Rsv

0.892542944388


Height range @ 1km [m]

322

Height range @ 2km [m]

423

Height range @ 5km [m]

876

Height range @ 10km [m]

-999

Height range @ 20km [m]

-999


Variance slope @ 1 km

14792

Variance slope @ 2 km

20536

Variance slope @ 5 km

23889

Variance slope @ 10 km

-999

Variance slope @ 20 km

-999


NDVI (max. NDVI composite)


Roman et al. (2009) index


St

5.42716239289

Rcv

-0.0536890773151

Rse

0.0

Rst

0.121835006116

Rsv

-0.377250973371


NDVI range @ 1km [-]

0.08

NDVI range @ 2km [-]

0.13

NDVI range @ 5km [-]

0.16

NDVI range @ 10km [-]

0.16

NDVI range @ 20km [-]

0.14


Variance slope @ 1 km

0.000283967549619

Variance slope @ 2 km

0.000338730301182

Variance slope @ 5 km

0.000283776741149

Variance slope @ 10 km

0.000159414446761

Variance slope @ 20 km

6.01412869931e-05


NDVI (min. NDVI composite)I


Roman et al. (2009) index


St

2.19407220594

Rcv

0.701404421075

Rse

0.0

Rst

0.505598726435

Rsv

-0.160317395486


NDVI range @ 1km [-]

0.01

NDVI range @ 2km [-]

0.05

NDVI range @ 5km [-]

0.13

NDVI range @ 10km [-]

0.15

NDVI range @ 20km [-]

0.19


NDVI slope @ 1 km

0.000392657713711

NDVI slope @ 2 km

0.000462716702711

NDVI slope @ 5 km

0.000392602481633

NDVI slope @ 10 km

0.000253676716501

NDVI slope @ 20 km

0.000129189670719


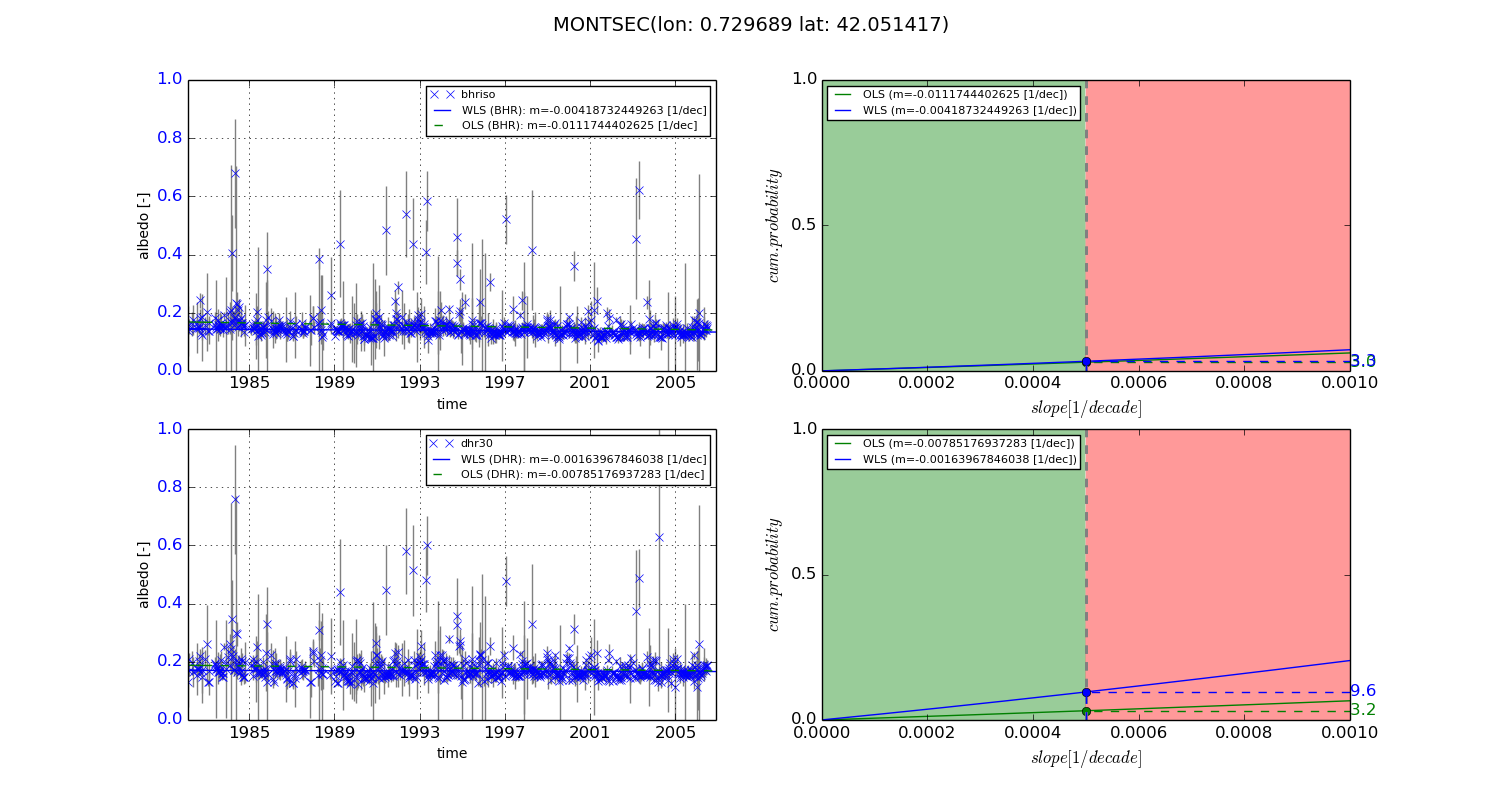
Temporal stability analysis

+000 deg (BHR)


BHR statistics

Temporal stability [1/decade]:


abs

rel


Weighted least square:

-0.00418732449263


Ordinary least square:

-0.0111744402625


Probabilities that GCOS criteria is met:

Weighted least square:

3.3 %

Ordinary least square:

3.0 %


DHR statistics

Temporal stability [1/decade]:


abs

rel


Weighted least square:

-0.00163967846038


Ordinary least square:

-0.00785176937283


Probabilities that GCOS criteria is met:

Weighted least square:

9.6 %

Ordinary least square:

3.2 %


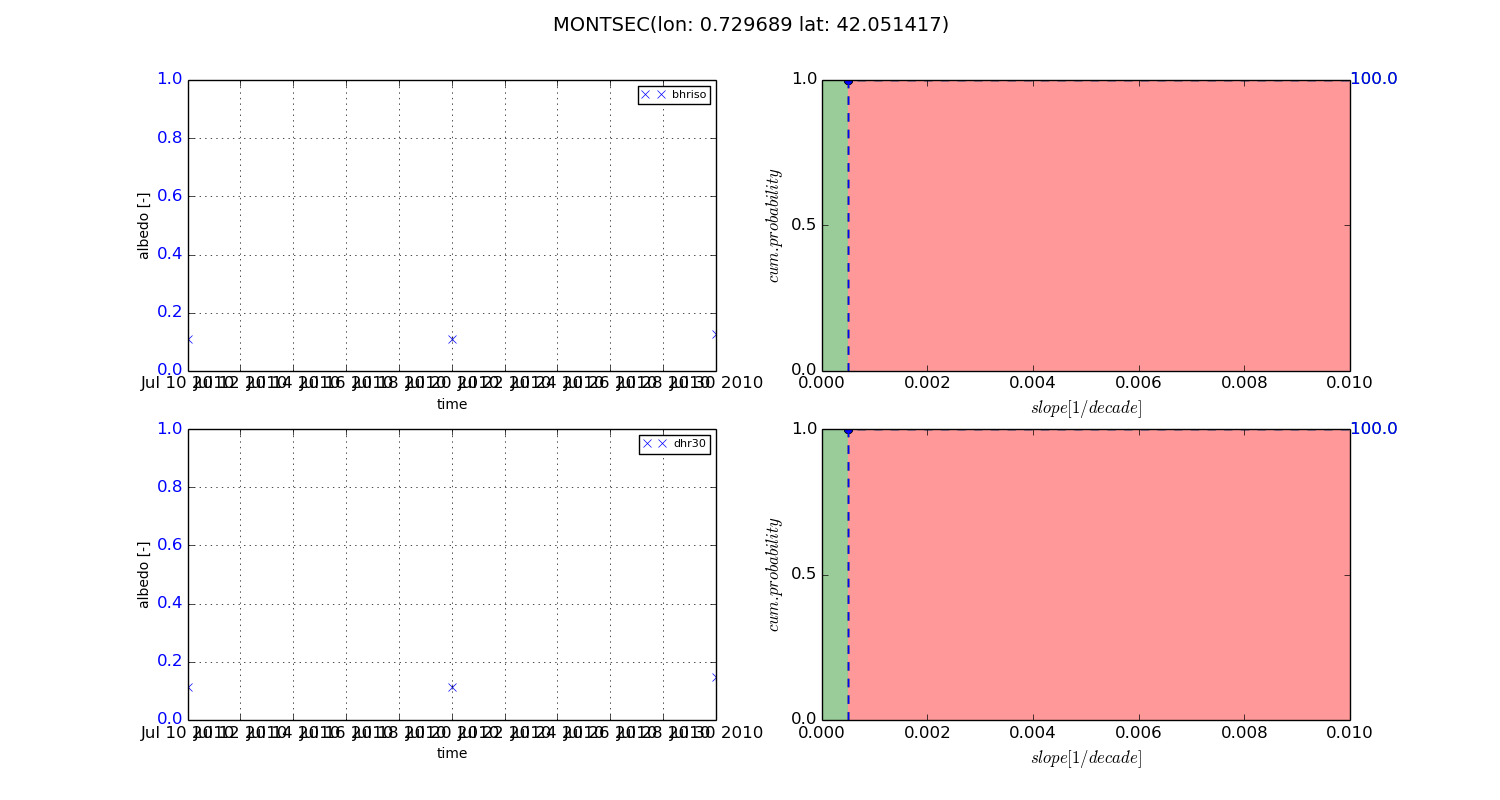
+057/+063 deg (BHR)


BHR statistics

Temporal stability [1/decade]:


abs

rel


Weighted least square:

-99999.0


Ordinary least square:

-99999.0


Probabilities that GCOS criteria is met:

Weighted least square:

-99999.0 %

Ordinary least square:

-99999.0 %


DHR statistics

Temporal stability [1/decade]:


abs

rel


Weighted least square:

-99999.0


Ordinary least square:

-99999.0


Probabilities that GCOS criteria is met:

Weighted least square:

-99999.0 %

Ordinary least square:

-99999.0 %


Temporal anomaly analyis

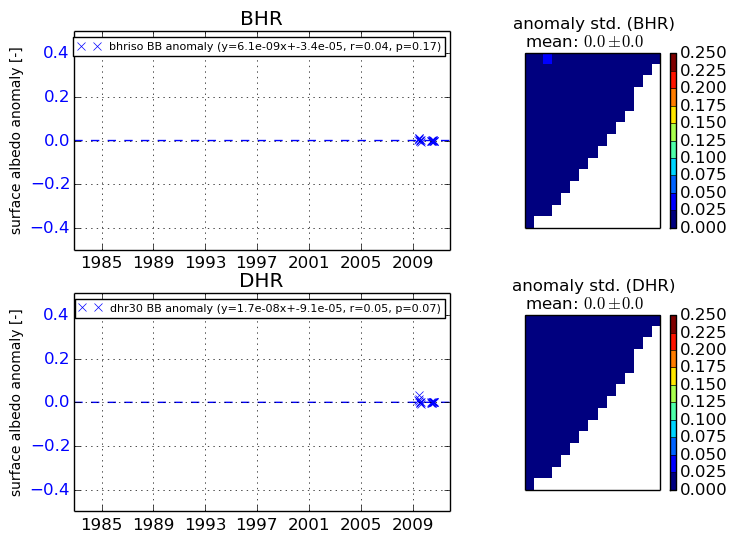
The variance of the temporal anomalies provides an additional measure about the stability of the signal AFTER removal of the mean seasonal cylce.
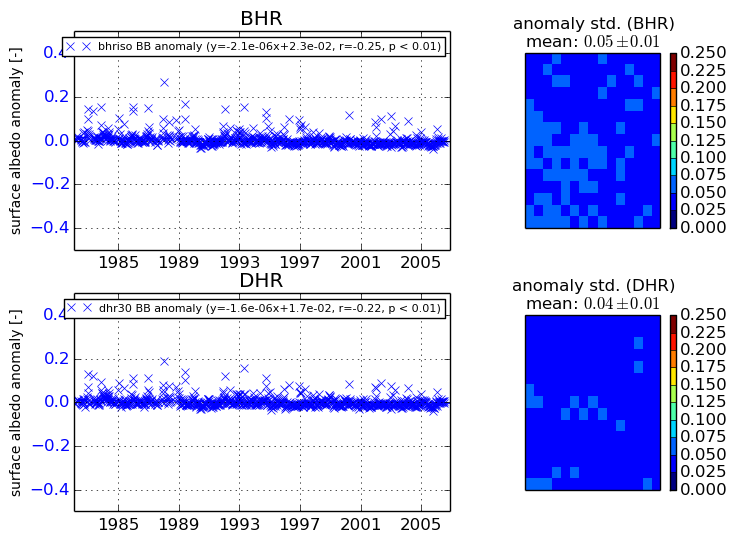
+000 deg


+057/+063 deg