MOUNT_CHACALTAYA


Location

lon / lat [deg]: -68.1315 / -16.3501

Source network: AERONET


Geostationary surface albedo (GSA) data


“+000”


“+057/+063”


Landcover information (based on ESA CCI landcover data)


Landcover fractions @ 2km distance


Landcover fractions @ 20 km distance


Legend


Distance to open water bodies [km]:

3.32

Distance to urban areas [km]:

8.5


Radius: 1 km

Number of landcover classes:

3

Dominant landcover type:

220: permanent snow and ice

Fraction of dominant landcover type [%]:

80.0


Radius: 2 km

Number of landcover classes:

5

Dominant landcover type:

120: Shrubland

Fraction of dominant landcover type [%]:

36.0


Radius: 5 km

Number of landcover classes:

9

Dominant landcover type:

130: grassland

Fraction of dominant landcover type [%]:

32.0


Radius: 10 km

Number of landcover classes:

7

Dominant landcover type:

130: grassland

Fraction of dominant landcover type [%]:

41.0


Radius: 20 km

Number of landcover classes:

9

Dominant landcover type:

120: Shrubland

Fraction of dominant landcover type [%]:

33.0


Disturbances


Heterogeneity analysis

The heterogeneity analysis provides information about the spatial and temporal heterogeneity of the site.

Topography


Roman et al. (2009) index


St

5.36952755278

Rcv

0.0552765541624

Rse

0.0

Rst

-0.0145623248534

Rsv

0.488869493464


Height range @ 1km [m]

296

Height range @ 2km [m]

502

Height range @ 5km [m]

671

Height range @ 10km [m]

-999

Height range @ 20km [m]

-999


Variance slope @ 1 km

12170

Variance slope @ 2 km

13841

Variance slope @ 5 km

12675

Variance slope @ 10 km

-999

Variance slope @ 20 km

-999


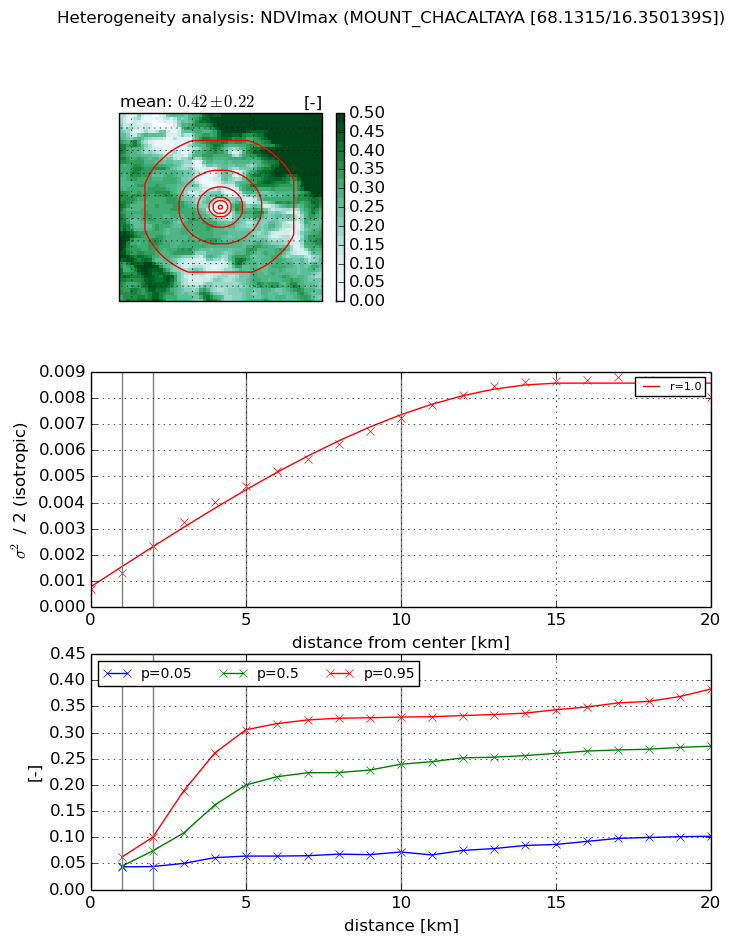
NDVI (max. NDVI composite)


Roman et al. (2009) index


St

5.47054664891

Rcv

0.0392134830501

Rse

0.0

Rst

-0.189098922172

Rsv

0.320078860319


NDVI range @ 1km [-]

0.02

NDVI range @ 2km [-]

0.06

NDVI range @ 5km [-]

0.24

NDVI range @ 10km [-]

0.26

NDVI range @ 20km [-]

0.28


Variance slope @ 1 km

0.000617532528676

Variance slope @ 2 km

0.000821584926041

Variance slope @ 5 km

0.000821556883838

Variance slope @ 10 km

0.000657240438702

Variance slope @ 20 km

0.000392602328416


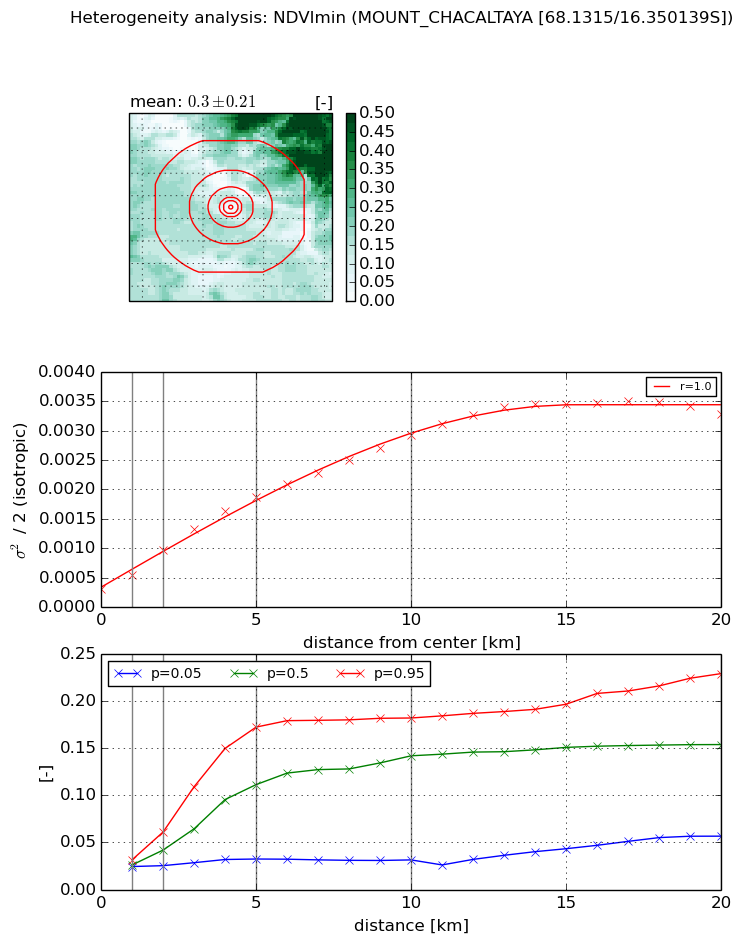
NDVI (min. NDVI composite)I


Roman et al. (2009) index


St

4.09090027912

Rcv

0.00342439429379

Rse

0.0

Rst

-0.22927198519

Rsv

0.500638533447


NDVI range @ 1km [-]

0.01

NDVI range @ 2km [-]

0.04

NDVI range @ 5km [-]

0.14

NDVI range @ 10km [-]

0.15

NDVI range @ 20km [-]

0.17


NDVI slope @ 1 km

0.000248167286868

NDVI slope @ 2 km

0.000329825912441

NDVI slope @ 5 km

0.000327384065499

NDVI slope @ 10 km

0.00026051109574

NDVI slope @ 20 km

0.000156557956535


Temporal stability analysis

+000 deg (BHR)


BHR statistics

Temporal stability [1/decade]:


abs

rel


Weighted least square:

-99999.0


Ordinary least square:

-99999.0


Probabilities that GCOS criteria is met:

Weighted least square:

-99999.0 %

Ordinary least square:

-99999.0 %


DHR statistics

Temporal stability [1/decade]:


abs

rel


Weighted least square:

-99999.0


Ordinary least square:

-99999.0


Probabilities that GCOS criteria is met:

Weighted least square:

-99999.0 %

Ordinary least square:

-99999.0 %


+057/+063 deg (BHR)


BHR statistics

Temporal stability [1/decade]:


abs

rel


Weighted least square:

None


Ordinary least square:

None


Probabilities that GCOS criteria is met:

Weighted least square:

None %

Ordinary least square:

None %


DHR statistics

Temporal stability [1/decade]:


abs

rel


Weighted least square:

None


Ordinary least square:

None


Probabilities that GCOS criteria is met:

Weighted least square:

None %

Ordinary least square:

None %


Temporal anomaly analyis

The variance of the temporal anomalies provides an additional measure about the stability of the signal AFTER removal of the mean seasonal cylce.

+000 deg


+057/+063 deg