MPI_MAINZ


Location

lon / lat [deg]: 8.2375 / 49.992

Source network: AERONET


Geostationary surface albedo (GSA) data


“+000”


“+057/+063”


Landcover information (based on ESA CCI landcover data)


Landcover fractions @ 2km distance


Landcover fractions @ 20 km distance


Legend


Distance to open water bodies [km]:

3.08

Distance to urban areas [km]:

0.12


Radius: 1 km

Number of landcover classes:

2

Dominant landcover type:

190: urban areas

Fraction of dominant landcover type [%]:

96.0


Radius: 2 km

Number of landcover classes:

2

Dominant landcover type:

190: urban areas

Fraction of dominant landcover type [%]:

87.0


Radius: 5 km

Number of landcover classes:

5

Dominant landcover type:

190: urban areas

Fraction of dominant landcover type [%]:

79.0


Radius: 10 km

Number of landcover classes:

6

Dominant landcover type:

190: urban areas

Fraction of dominant landcover type [%]:

61.0


Radius: 20 km

Number of landcover classes:

7

Dominant landcover type:

190: urban areas

Fraction of dominant landcover type [%]:

38.0


Disturbances


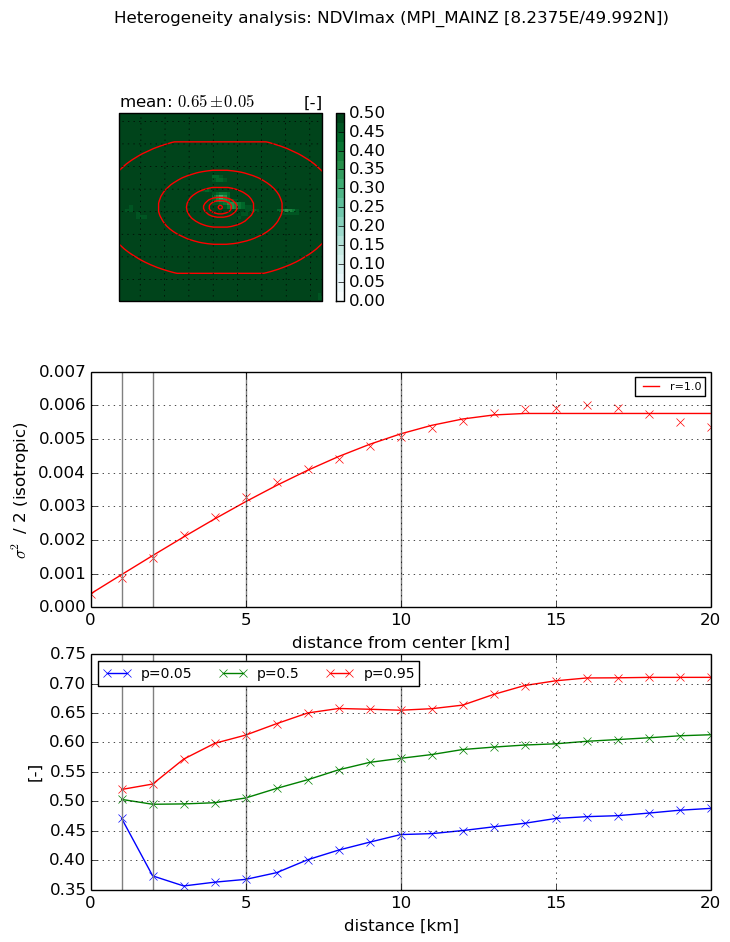
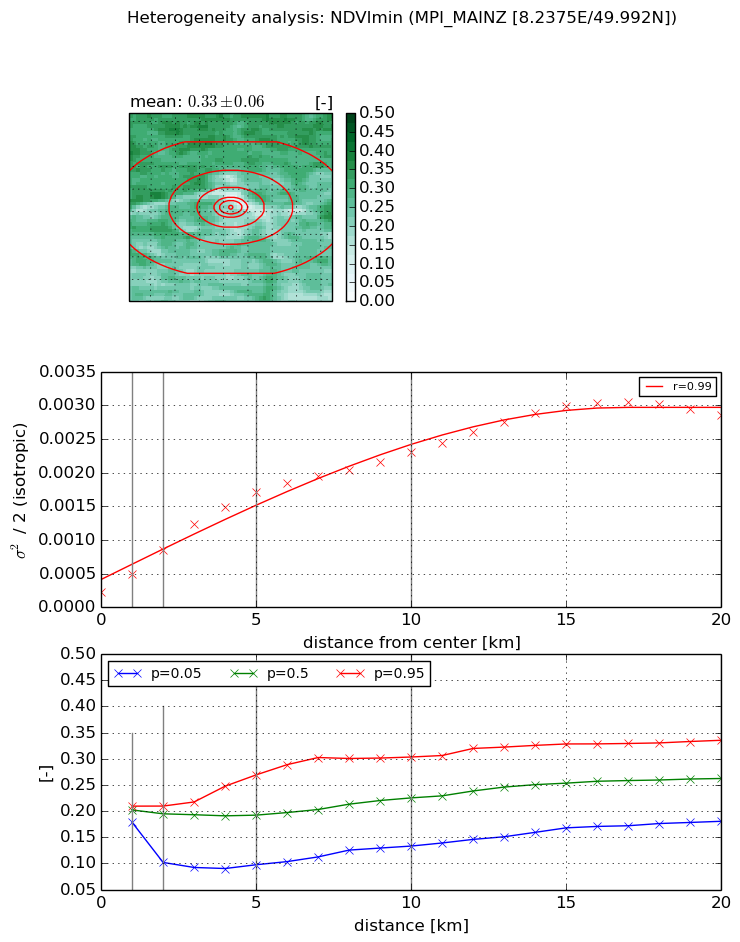
Heterogeneity analysis

The heterogeneity analysis provides information about the spatial and temporal heterogeneity of the site.

Topography


Roman et al. (2009) index


St

0.48981775103

Rcv

1.01920791488

Rse

0.0

Rst

6.91057548106e-06

Rsv

5.10551216472


Height range @ 1km [m]

18

Height range @ 2km [m]

30

Height range @ 5km [m]

119

Height range @ 10km [m]

-999

Height range @ 20km [m]

-999


Variance slope @ 1 km

182

Variance slope @ 2 km

210

Variance slope @ 5 km

297

Variance slope @ 10 km

-999

Variance slope @ 20 km

-999


NDVI (max. NDVI composite)


Roman et al. (2009) index


St

7.6484518619

Rcv

0.0459381462778

Rse

0.0

Rst

-0.0594930142292

Rsv

0.286805079476


NDVI range @ 1km [-]

0.05

NDVI range @ 2km [-]

0.16

NDVI range @ 5km [-]

0.25

NDVI range @ 10km [-]

0.21

NDVI range @ 20km [-]

0.22


Variance slope @ 1 km

0.000448880993916

Variance slope @ 2 km

0.000528281725051

Variance slope @ 5 km

0.000587062795715

Variance slope @ 10 km

0.000481334618281

Variance slope @ 20 km

0.000262340630231


NDVI (min. NDVI composite)I


Roman et al. (2009) index


St

3.80268779007

Rcv

0.138523245863

Rse

0.0

Rst

-0.130264720304

Rsv

0.520127707593


NDVI range @ 1km [-]

0.03

NDVI range @ 2km [-]

0.11

NDVI range @ 5km [-]

0.17

NDVI range @ 10km [-]

0.17

NDVI range @ 20km [-]

0.15


NDVI slope @ 1 km

0.000261154690829

NDVI slope @ 2 km

0.000311587013437

NDVI slope @ 5 km

0.000309716514671

NDVI slope @ 10 km

0.000203073375826

NDVI slope @ 20 km

0.000132400215496


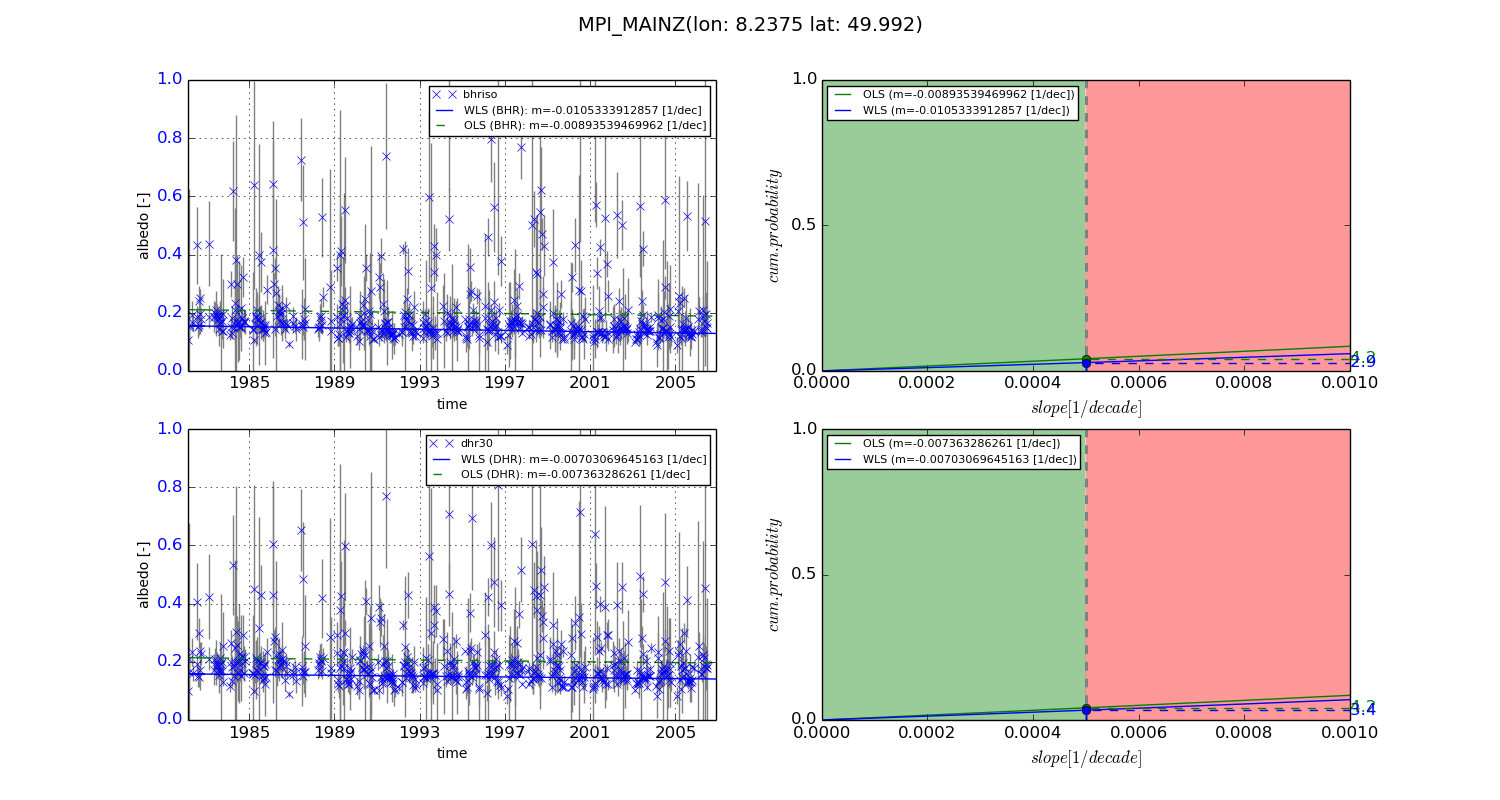
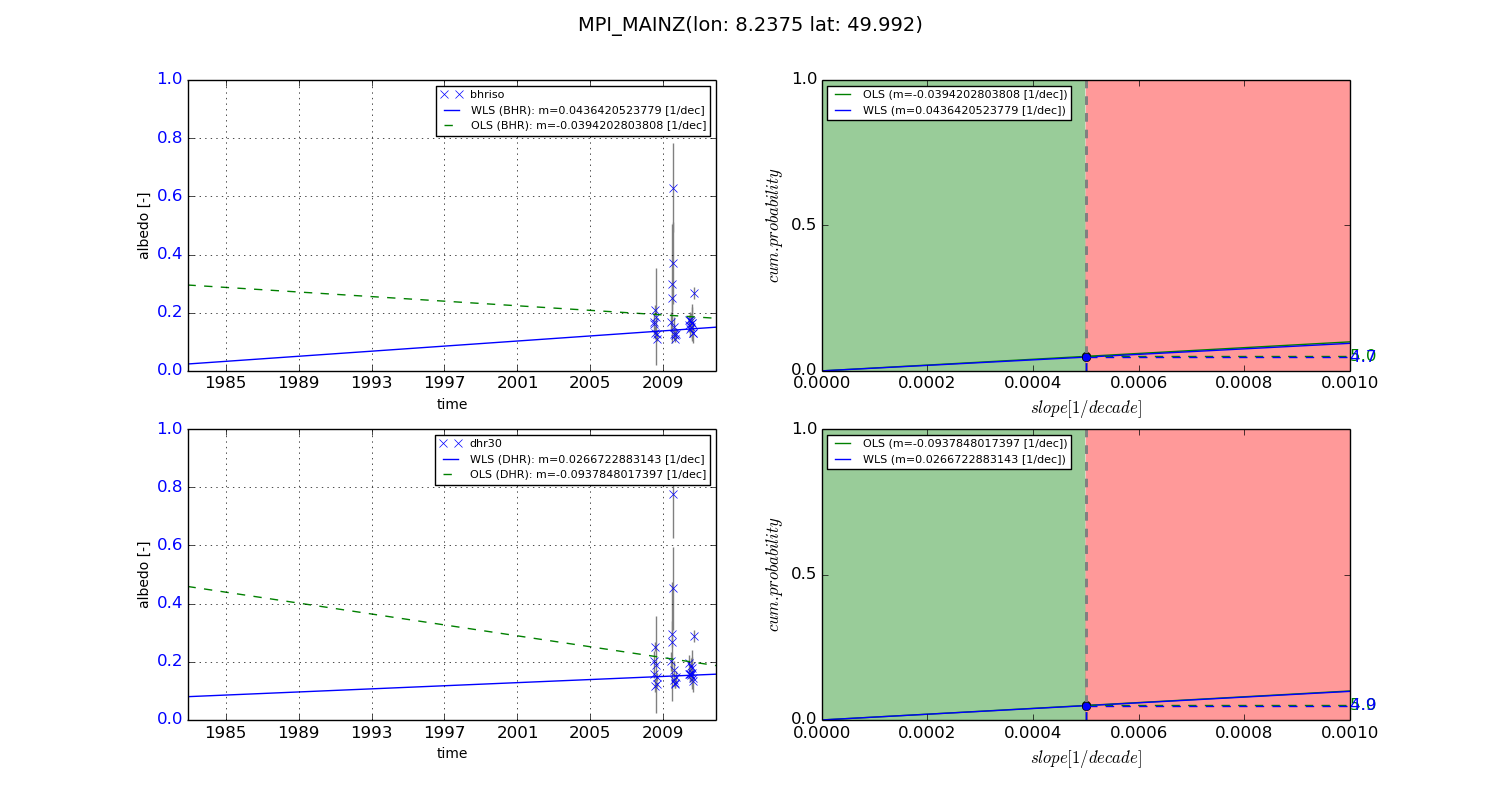
Temporal stability analysis

+000 deg (BHR)


BHR statistics

Temporal stability [1/decade]:


abs

rel


Weighted least square:

-0.0105333912857


Ordinary least square:

-0.00893539469962


Probabilities that GCOS criteria is met:

Weighted least square:

2.9 %

Ordinary least square:

4.2 %


DHR statistics

Temporal stability [1/decade]:


abs

rel


Weighted least square:

-0.00703069645163


Ordinary least square:

-0.007363286261


Probabilities that GCOS criteria is met:

Weighted least square:

3.4 %

Ordinary least square:

4.2 %


+057/+063 deg (BHR)


BHR statistics

Temporal stability [1/decade]:


abs

rel


Weighted least square:

0.0436420523779


Ordinary least square:

-0.0394202803808


Probabilities that GCOS criteria is met:

Weighted least square:

4.7 %

Ordinary least square:

5.0 %


DHR statistics

Temporal stability [1/decade]:


abs

rel


Weighted least square:

0.0266722883143


Ordinary least square:

-0.0937848017397


Probabilities that GCOS criteria is met:

Weighted least square:

4.9 %

Ordinary least square:

5.0 %


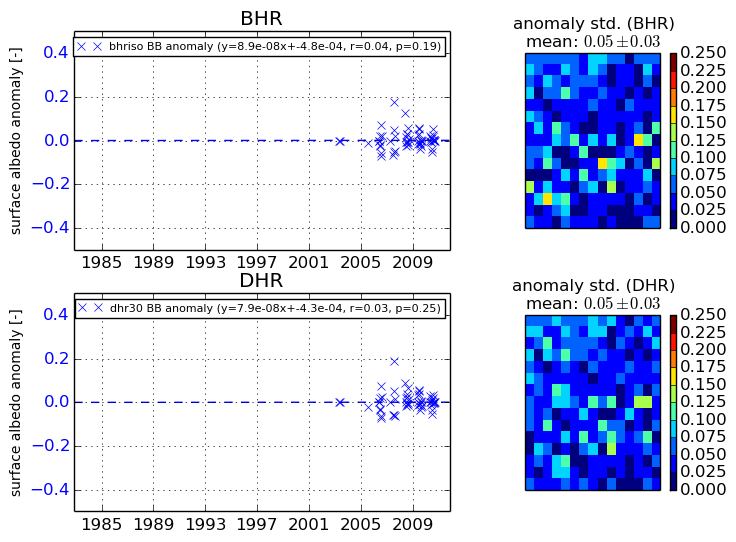
Temporal anomaly analyis

The variance of the temporal anomalies provides an additional measure about the stability of the signal AFTER removal of the mean seasonal cylce.
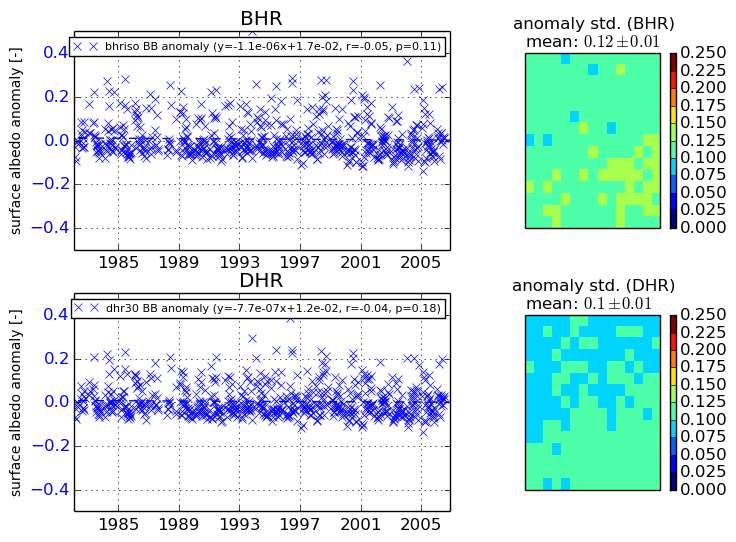
+000 deg


+057/+063 deg