MUKDAHAN


Location

lon / lat [deg]: 104.6761 / 16.6067

Source network: AERONET


Geostationary surface albedo (GSA) data


“+000”


“+057/+063”


Landcover information (based on ESA CCI landcover data)


Landcover fractions @ 2km distance


Landcover fractions @ 20 km distance


Legend


Distance to open water bodies [km]:

6.26

Distance to urban areas [km]:

2.18


Radius: 1 km

Number of landcover classes:

2

Dominant landcover type:

10: cropland, rainfed

Fraction of dominant landcover type [%]:

86.0


Radius: 2 km

Number of landcover classes:

3

Dominant landcover type:

10: cropland, rainfed

Fraction of dominant landcover type [%]:

78.0


Radius: 5 km

Number of landcover classes:

4

Dominant landcover type:

10: cropland, rainfed

Fraction of dominant landcover type [%]:

86.0


Radius: 10 km

Number of landcover classes:

6

Dominant landcover type:

10: cropland, rainfed

Fraction of dominant landcover type [%]:

78.0


Radius: 20 km

Number of landcover classes:

9

Dominant landcover type:

10: cropland, rainfed

Fraction of dominant landcover type [%]:

67.0


Disturbances


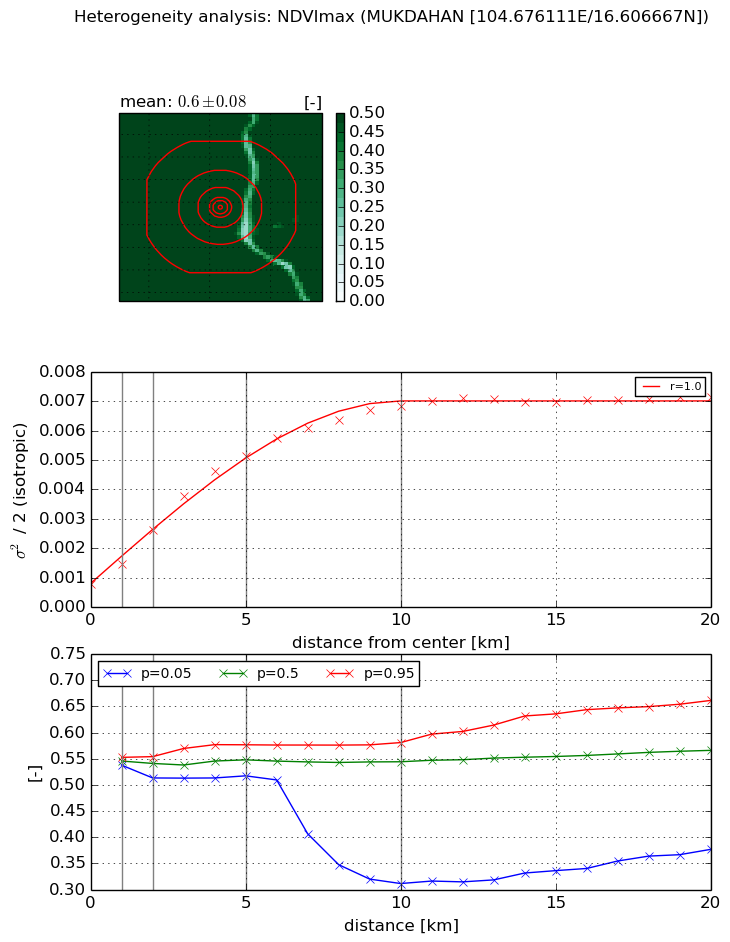
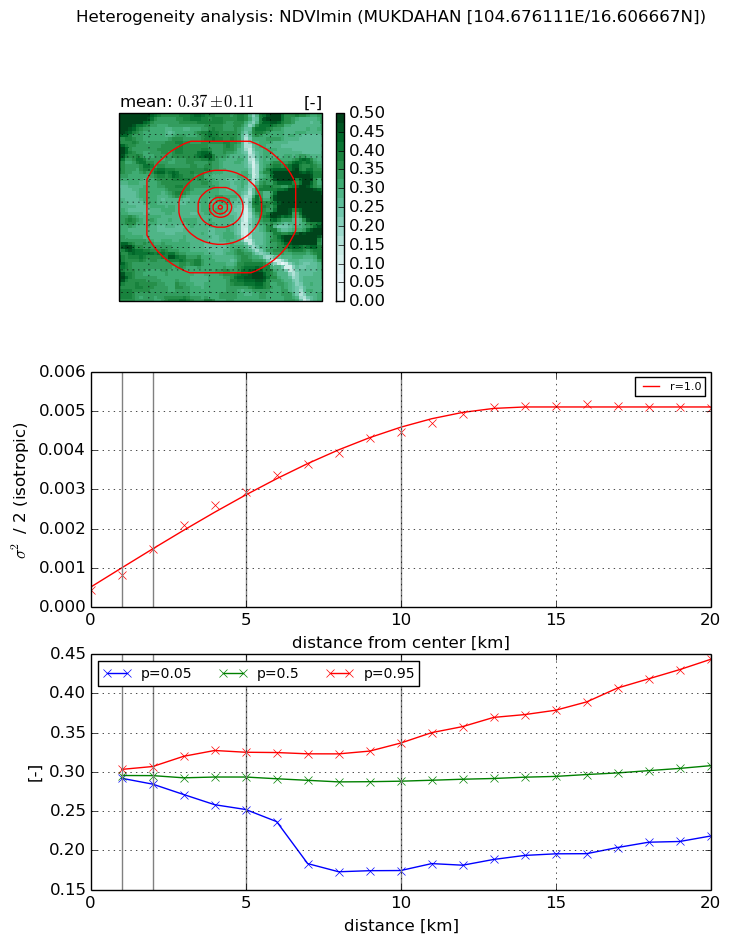
Heterogeneity analysis

The heterogeneity analysis provides information about the spatial and temporal heterogeneity of the site.

Topography


Roman et al. (2009) index


St

3.52159150877e-05

Rcv

0.106259153408

Rse

0.0

Rst

-0.0337472988316

Rsv

85188.6160582


Height range @ 1km [m]

18

Height range @ 2km [m]

30

Height range @ 5km [m]

42

Height range @ 10km [m]

-999

Height range @ 20km [m]

-999


Variance slope @ 1 km

109

Variance slope @ 2 km

81

Variance slope @ 5 km

41

Variance slope @ 10 km

-999

Variance slope @ 20 km

-999


NDVI (max. NDVI composite)


Roman et al. (2009) index


St

8.55699695475e-07

Rcv

-0.0350854878545

Rse

0.0

Rst

0.880859594053

Rsv

3505901.93276


NDVI range @ 1km [-]

0.01

NDVI range @ 2km [-]

0.04

NDVI range @ 5km [-]

0.06

NDVI range @ 10km [-]

0.27

NDVI range @ 20km [-]

0.28


Variance slope @ 1 km

0.000683732534488

Variance slope @ 2 km

0.000924856585541

Variance slope @ 5 km

0.00092948392561

Variance slope @ 10 km

0.000619317131234

Variance slope @ 20 km

0.000268366427548


NDVI (min. NDVI composite)I


Roman et al. (2009) index


St

2.53877984186

Rcv

0.44740684938

Rse

0.0

Rst

-0.224338639893

Rsv

0.509924520287


NDVI range @ 1km [-]

0.01

NDVI range @ 2km [-]

0.02

NDVI range @ 5km [-]

0.07

NDVI range @ 10km [-]

0.16

NDVI range @ 20km [-]

0.23


NDVI slope @ 1 km

0.000387389120721

NDVI slope @ 2 km

0.000517014432264

NDVI slope @ 5 km

0.000525612453814

NDVI slope @ 10 km

0.000412200442464

NDVI slope @ 20 km

0.000227398918467


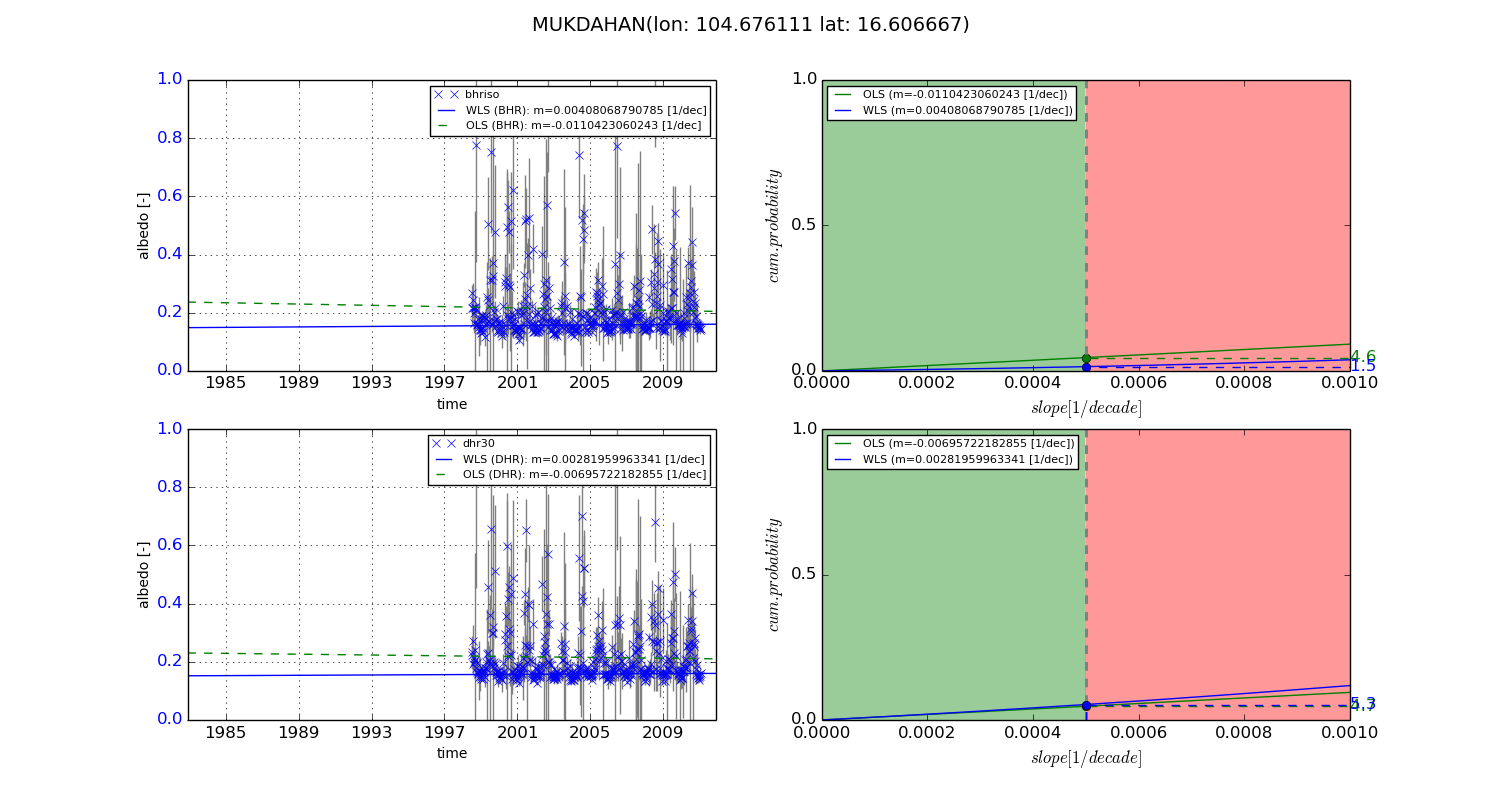
Temporal stability analysis

+000 deg (BHR)


BHR statistics

Temporal stability [1/decade]:


abs

rel


Weighted least square:

None


Ordinary least square:

None


Probabilities that GCOS criteria is met:

Weighted least square:

None %

Ordinary least square:

None %


DHR statistics

Temporal stability [1/decade]:


abs

rel


Weighted least square:

None


Ordinary least square:

None


Probabilities that GCOS criteria is met:

Weighted least square:

None %

Ordinary least square:

None %


+057/+063 deg (BHR)


BHR statistics

Temporal stability [1/decade]:


abs

rel


Weighted least square:

0.00408068790785


Ordinary least square:

-0.0110423060243


Probabilities that GCOS criteria is met:

Weighted least square:

1.5 %

Ordinary least square:

4.6 %


DHR statistics

Temporal stability [1/decade]:


abs

rel


Weighted least square:

0.00281959963341


Ordinary least square:

-0.00695722182855


Probabilities that GCOS criteria is met:

Weighted least square:

5.3 %

Ordinary least square:

4.7 %


Temporal anomaly analyis

The variance of the temporal anomalies provides an additional measure about the stability of the signal AFTER removal of the mean seasonal cylce.

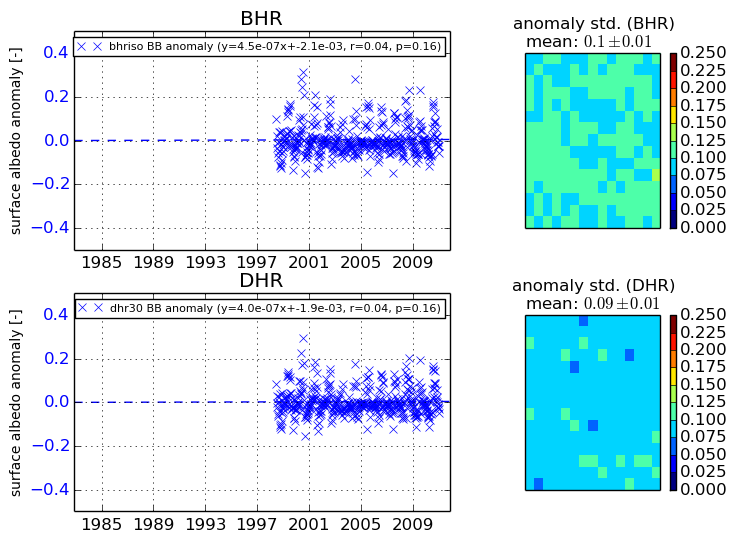
+000 deg


+057/+063 deg