MUNICH_UNIVERSITY


Location

lon / lat [deg]: 11.573 / 48.148

Source network: AERONET


Geostationary surface albedo (GSA) data


“+000”


“+057/+063”


Landcover information (based on ESA CCI landcover data)


Landcover fractions @ 2km distance


Landcover fractions @ 20 km distance


Legend


Distance to open water bodies [km]:

7.06

Distance to urban areas [km]:

0.08


Radius: 1 km

Number of landcover classes:

1

Dominant landcover type:

190: urban areas

Fraction of dominant landcover type [%]:

100.0


Radius: 2 km

Number of landcover classes:

1

Dominant landcover type:

190: urban areas

Fraction of dominant landcover type [%]:

100.0


Radius: 5 km

Number of landcover classes:

1

Dominant landcover type:

190: urban areas

Fraction of dominant landcover type [%]:

100.0


Radius: 10 km

Number of landcover classes:

4

Dominant landcover type:

190: urban areas

Fraction of dominant landcover type [%]:

92.0


Radius: 20 km

Number of landcover classes:

7

Dominant landcover type:

190: urban areas

Fraction of dominant landcover type [%]:

50.0


Disturbances


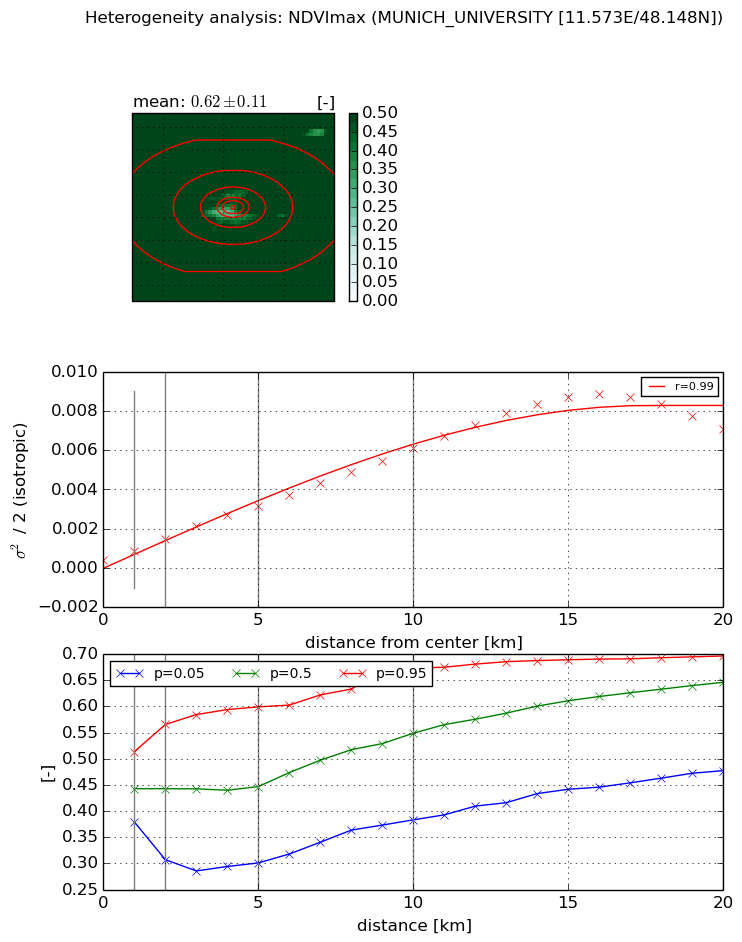
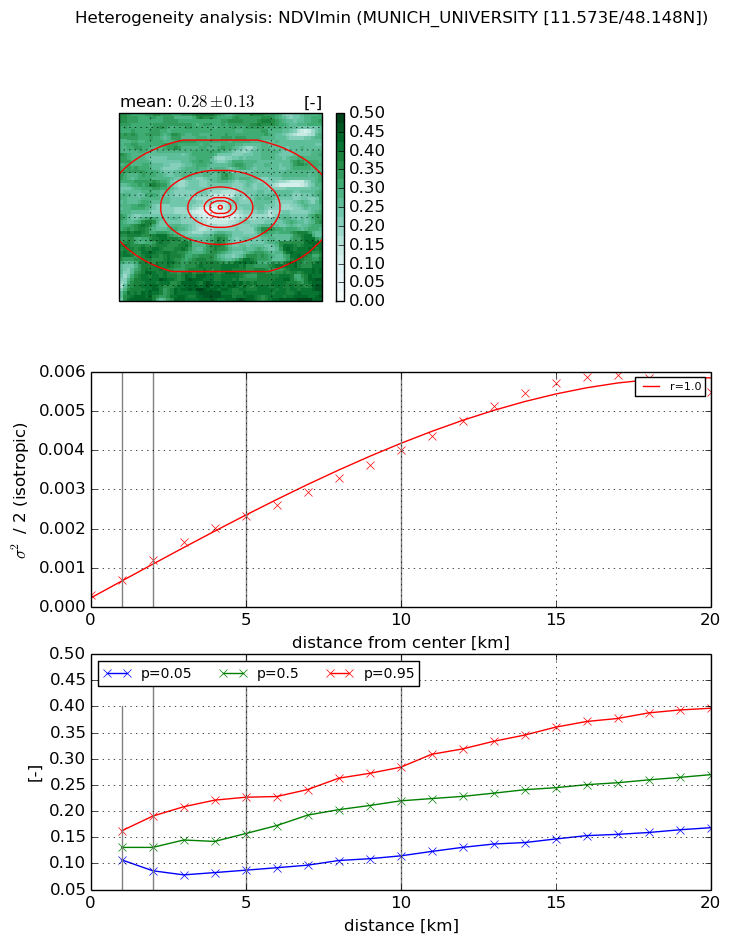
Heterogeneity analysis

The heterogeneity analysis provides information about the spatial and temporal heterogeneity of the site.

Topography


Roman et al. (2009) index


St

3.82907033186

Rcv

0.478529077395

Rse

0.0

Rst

-2.86183475126e-09

Rsv

-0.304950913578


Height range @ 1km [m]

12

Height range @ 2km [m]

17

Height range @ 5km [m]

36

Height range @ 10km [m]

-999

Height range @ 20km [m]

-999


Variance slope @ 1 km

19

Variance slope @ 2 km

21

Variance slope @ 5 km

24

Variance slope @ 10 km

-999

Variance slope @ 20 km

-999


NDVI (max. NDVI composite)


Roman et al. (2009) index


St

7.71251222349e-07

Rcv

-0.162820508817

Rse

0.0

Rst

0.2891733357

Rsv

3889782.6862


NDVI range @ 1km [-]

0.13

NDVI range @ 2km [-]

0.26

NDVI range @ 5km [-]

0.3

NDVI range @ 10km [-]

0.29

NDVI range @ 20km [-]

0.22


Variance slope @ 1 km

0.000466002625382

Variance slope @ 2 km

0.000547197819836

Variance slope @ 5 km

0.00057249274152

Variance slope @ 10 km

0.000569057545637

Variance slope @ 20 km

0.000428414649369


NDVI (min. NDVI composite)I


Roman et al. (2009) index


St

1.17699419788e-06

Rcv

-0.144998245827

Rse

0.0

Rst

0.292764741443

Rsv

2548865.14322


NDVI range @ 1km [-]

0.06

NDVI range @ 2km [-]

0.1

NDVI range @ 5km [-]

0.14

NDVI range @ 10km [-]

0.17

NDVI range @ 20km [-]

0.23


NDVI slope @ 1 km

0.000379350956208

NDVI slope @ 2 km

0.000435697006348

NDVI slope @ 5 km

0.000411559690315

NDVI slope @ 10 km

0.00035989593088

NDVI slope @ 20 km

0.000293209824903


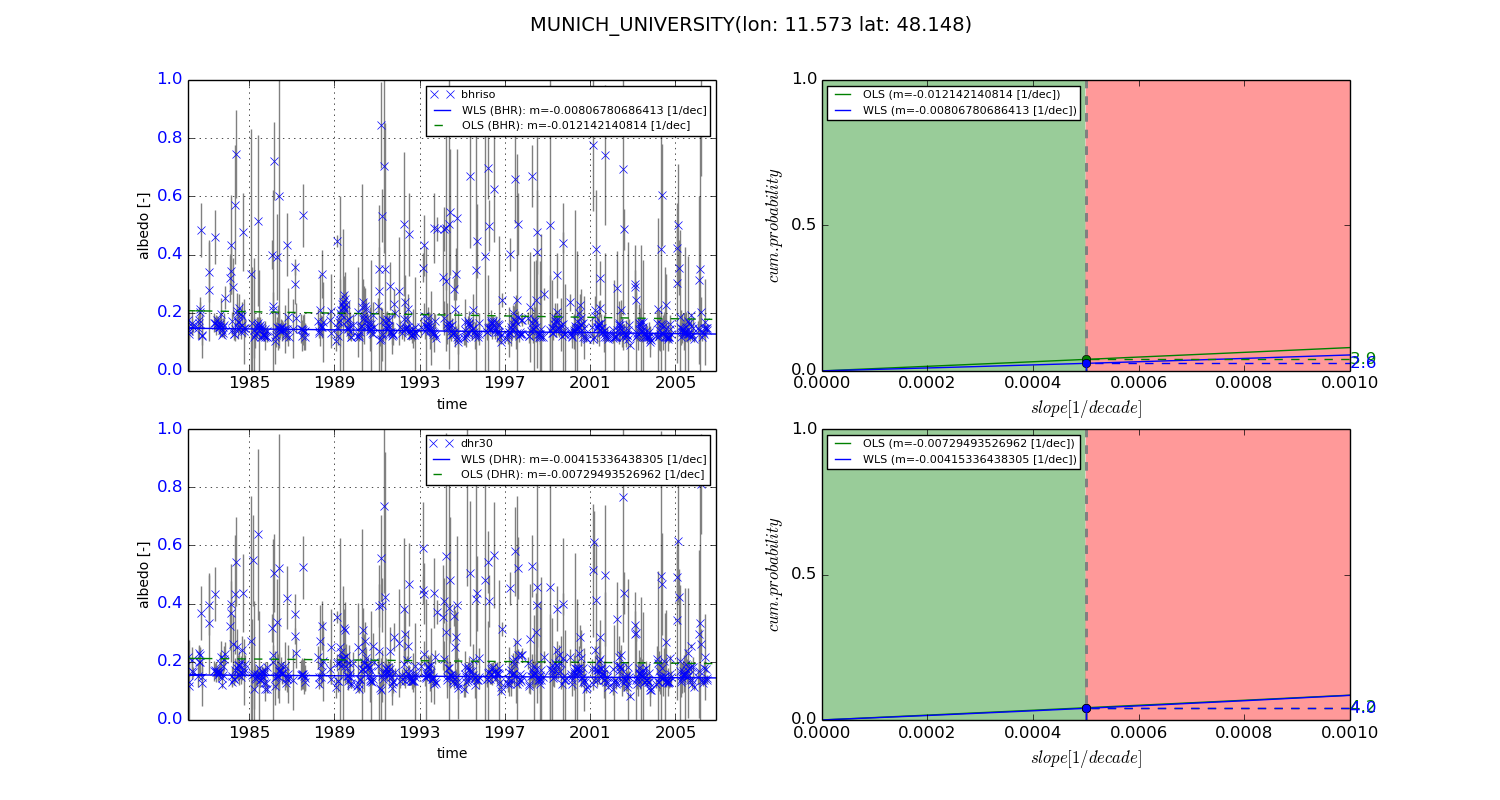
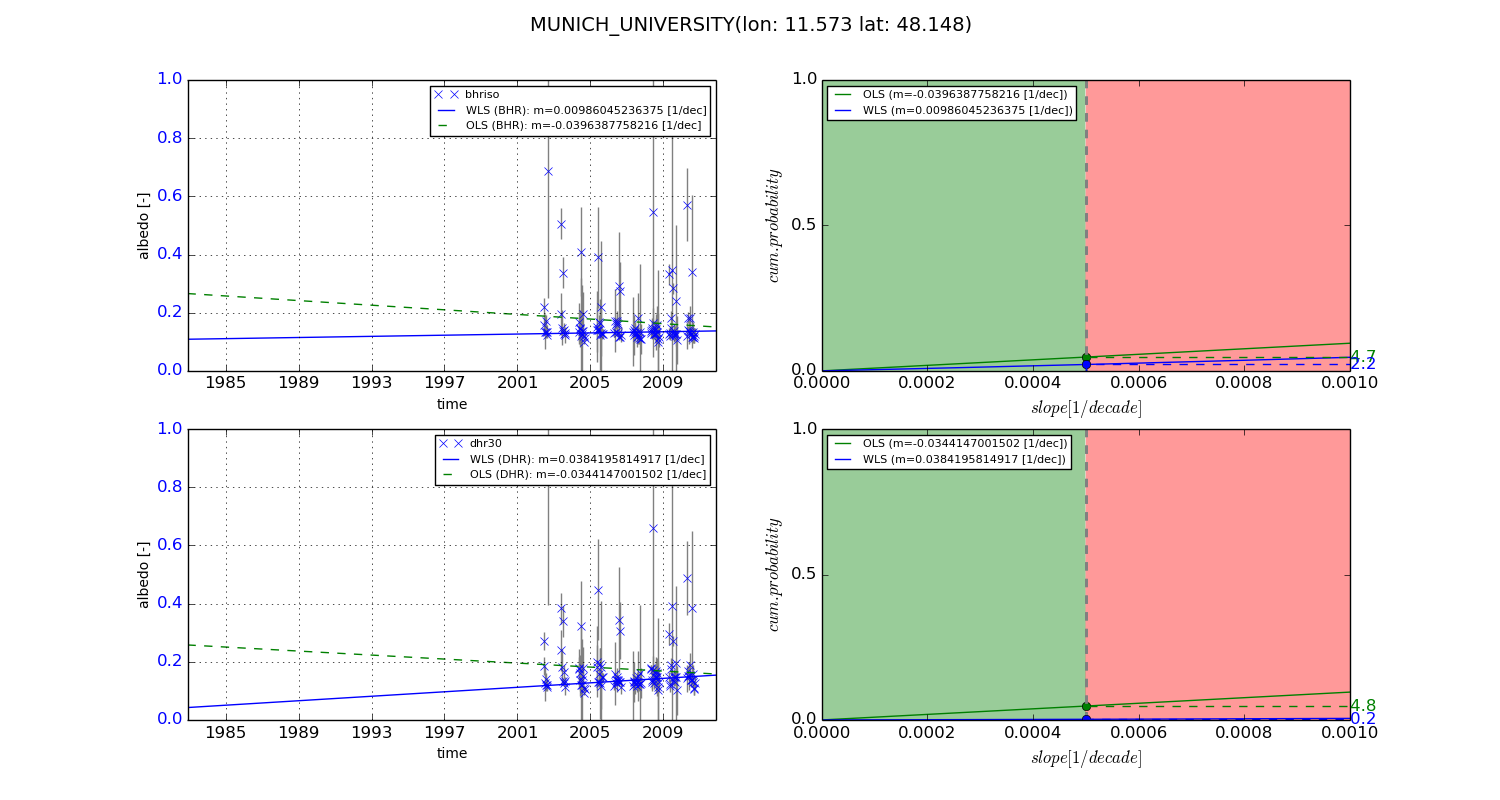
Temporal stability analysis

+000 deg (BHR)


BHR statistics

Temporal stability [1/decade]:


abs

rel


Weighted least square:

-0.00806780686413


Ordinary least square:

-0.012142140814


Probabilities that GCOS criteria is met:

Weighted least square:

2.6 %

Ordinary least square:

3.9 %


DHR statistics

Temporal stability [1/decade]:


abs

rel


Weighted least square:

-0.00415336438305


Ordinary least square:

-0.00729493526962


Probabilities that GCOS criteria is met:

Weighted least square:

4.0 %

Ordinary least square:

4.2 %


+057/+063 deg (BHR)


BHR statistics

Temporal stability [1/decade]:


abs

rel


Weighted least square:

0.00986045236375


Ordinary least square:

-0.0396387758216


Probabilities that GCOS criteria is met:

Weighted least square:

2.2 %

Ordinary least square:

4.7 %


DHR statistics

Temporal stability [1/decade]:


abs

rel


Weighted least square:

0.0384195814917


Ordinary least square:

-0.0344147001502


Probabilities that GCOS criteria is met:

Weighted least square:

0.2 %

Ordinary least square:

4.8 %


Temporal anomaly analyis

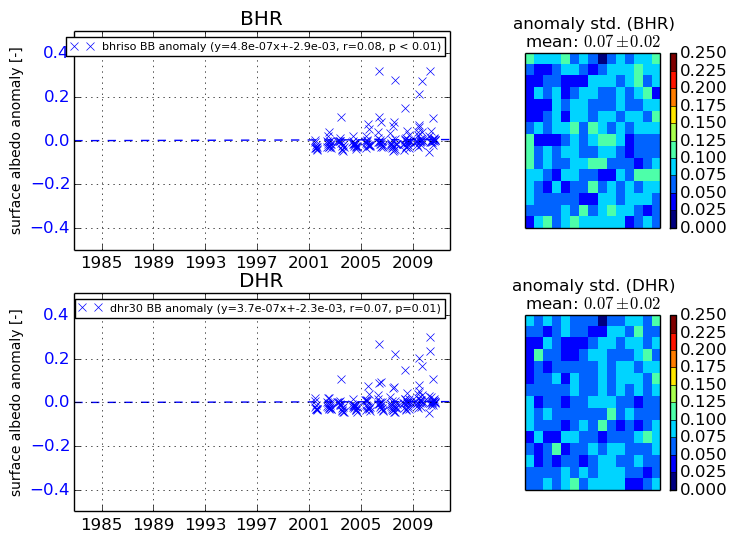
The variance of the temporal anomalies provides an additional measure about the stability of the signal AFTER removal of the mean seasonal cylce.
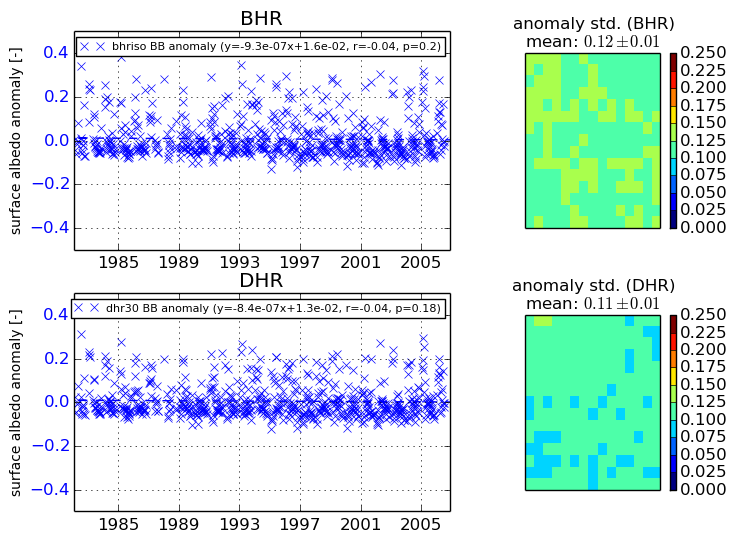
+000 deg


+057/+063 deg