MURCIA


Location

lon / lat [deg]: -1.1707 / 38.001

Source network: AERONET


Geostationary surface albedo (GSA) data


“+000”


“+057/+063”


Landcover information (based on ESA CCI landcover data)


Landcover fractions @ 2km distance


Landcover fractions @ 20 km distance


Legend


Distance to open water bodies [km]:

3.75

Distance to urban areas [km]:

0.04


Radius: 1 km

Number of landcover classes:

3

Dominant landcover type:

190: urban areas

Fraction of dominant landcover type [%]:

55.0


Radius: 2 km

Number of landcover classes:

4

Dominant landcover type:

190: urban areas

Fraction of dominant landcover type [%]:

46.0


Radius: 5 km

Number of landcover classes:

5

Dominant landcover type:

190: urban areas

Fraction of dominant landcover type [%]:

52.0


Radius: 10 km

Number of landcover classes:

8

Dominant landcover type:

190: urban areas

Fraction of dominant landcover type [%]:

43.0


Radius: 20 km

Number of landcover classes:

11

Dominant landcover type:

10: cropland, rainfed

Fraction of dominant landcover type [%]:

23.0


Disturbances


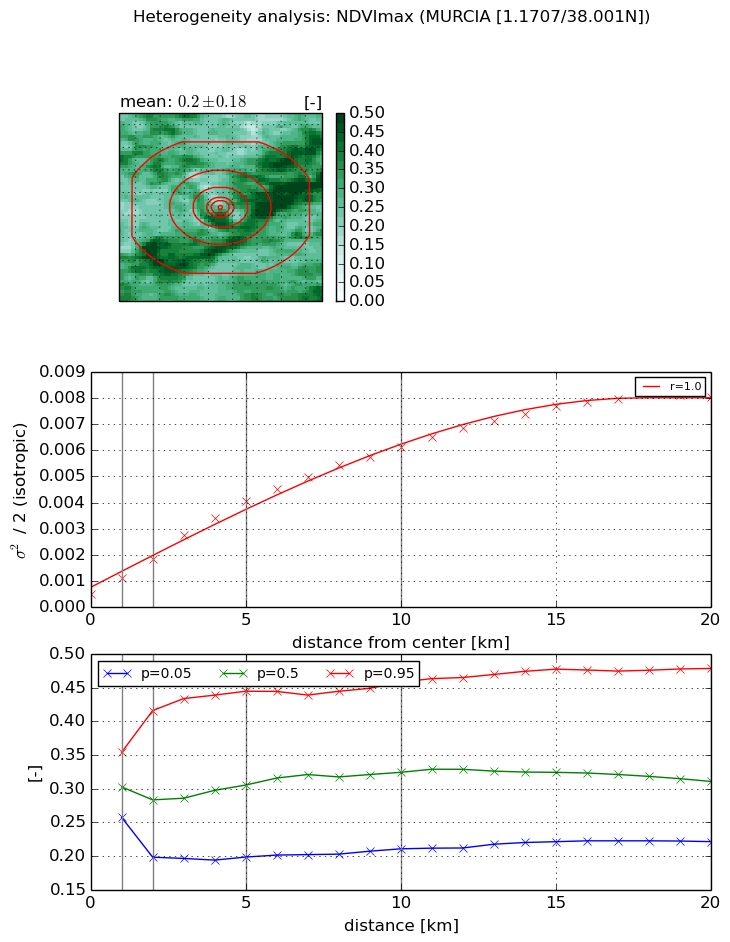
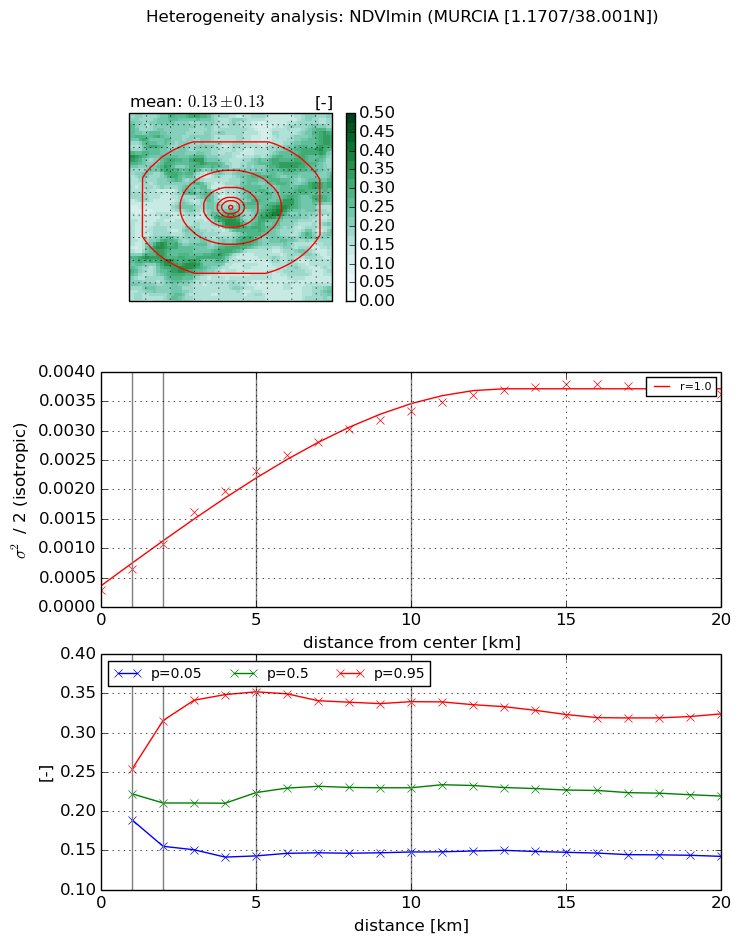
Heterogeneity analysis

The heterogeneity analysis provides information about the spatial and temporal heterogeneity of the site.

Topography


Roman et al. (2009) index


St

22.2609317609

Rcv

0.0768273688014

Rse

0.0

Rst

-3.35603959512e-07

Rsv

0.0579375440679


Height range @ 1km [m]

38

Height range @ 2km [m]

76

Height range @ 5km [m]

106

Height range @ 10km [m]

-999

Height range @ 20km [m]

-999


Variance slope @ 1 km

160

Variance slope @ 2 km

215

Variance slope @ 5 km

270

Variance slope @ 10 km

-999

Variance slope @ 20 km

-999


NDVI (max. NDVI composite)


Roman et al. (2009) index


St

6.70836503671

Rcv

0.0302895842107

Rse

0.0

Rst

-0.0668374555236

Rsv

0.350075815743


NDVI range @ 1km [-]

0.1

NDVI range @ 2km [-]

0.22

NDVI range @ 5km [-]

0.25

NDVI range @ 10km [-]

0.25

NDVI range @ 20km [-]

0.26


Variance slope @ 1 km

0.00059012651963

Variance slope @ 2 km

0.000661909383935

Variance slope @ 5 km

0.000729110725345

Variance slope @ 10 km

0.000572314759022

Variance slope @ 20 km

0.000379005976667


NDVI (min. NDVI composite)I


Roman et al. (2009) index


St

7.08679645271

Rcv

0.0617003805027

Rse

0.0

Rst

0.0137286342372

Rsv

0.347893430037


NDVI range @ 1km [-]

0.06

NDVI range @ 2km [-]

0.16

NDVI range @ 5km [-]

0.21

NDVI range @ 10km [-]

0.19

NDVI range @ 20km [-]

0.18


NDVI slope @ 1 km

0.000350939889311

NDVI slope @ 2 km

0.000390743493009

NDVI slope @ 5 km

0.000419427983484

NDVI slope @ 10 km

0.000311449774858

NDVI slope @ 20 km

0.000161563931667


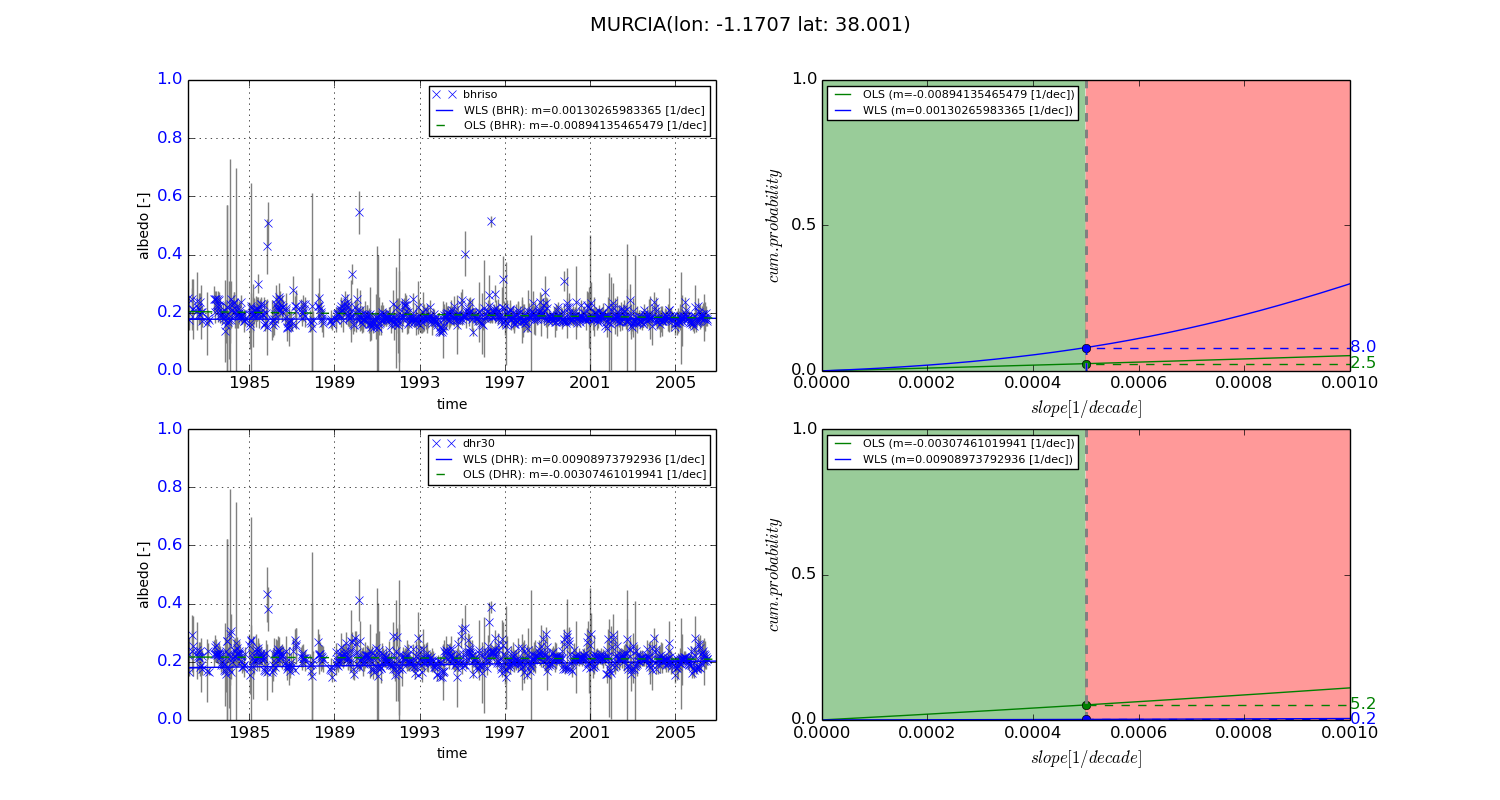
Temporal stability analysis

+000 deg (BHR)


BHR statistics

Temporal stability [1/decade]:


abs

rel


Weighted least square:

0.00130265983365


Ordinary least square:

-0.00894135465479


Probabilities that GCOS criteria is met:

Weighted least square:

8.0 %

Ordinary least square:

2.5 %


DHR statistics

Temporal stability [1/decade]:


abs

rel


Weighted least square:

0.00908973792936


Ordinary least square:

-0.00307461019941


Probabilities that GCOS criteria is met:

Weighted least square:

0.2 %

Ordinary least square:

5.2 %


+057/+063 deg (BHR)


BHR statistics

Temporal stability [1/decade]:


abs

rel


Weighted least square:

-99999.0


Ordinary least square:

-99999.0


Probabilities that GCOS criteria is met:

Weighted least square:

-99999.0 %

Ordinary least square:

-99999.0 %


DHR statistics

Temporal stability [1/decade]:


abs

rel


Weighted least square:

-99999.0


Ordinary least square:

-99999.0


Probabilities that GCOS criteria is met:

Weighted least square:

-99999.0 %

Ordinary least square:

-99999.0 %


Temporal anomaly analyis

The variance of the temporal anomalies provides an additional measure about the stability of the signal AFTER removal of the mean seasonal cylce.
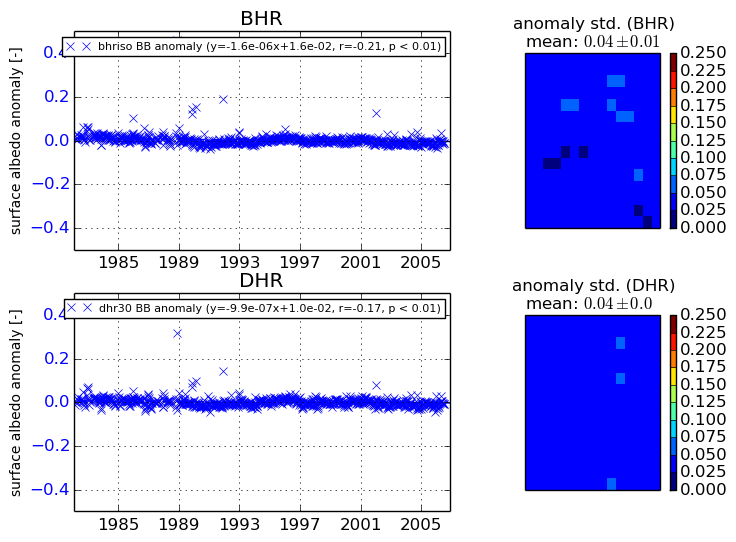
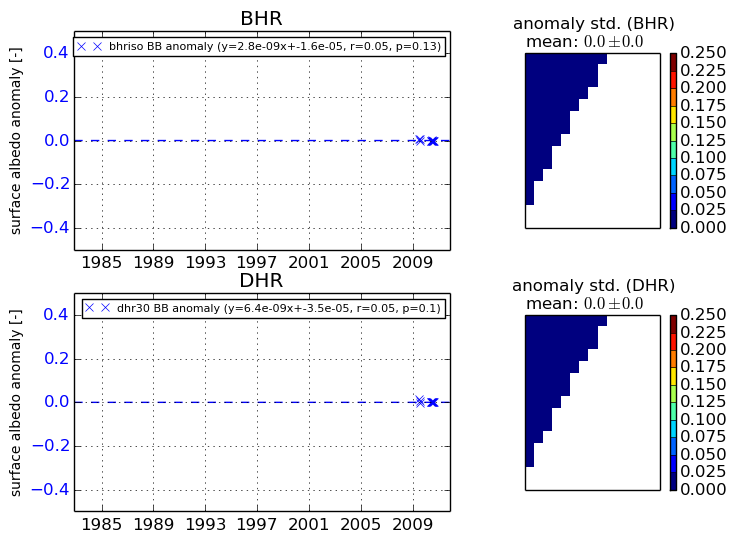
+000 deg


+057/+063 deg