MUZTAGH_ATA


Location

lon / lat [deg]: 75.0388 / 38.4082

Source network: AERONET


Geostationary surface albedo (GSA) data


“+000”


“+057/+063”


Landcover information (based on ESA CCI landcover data)


Landcover fractions @ 2km distance


Landcover fractions @ 20 km distance


Legend


Distance to open water bodies [km]:

3.15

Distance to urban areas [km]:

30.37


Radius: 1 km

Number of landcover classes:

3

Dominant landcover type:

130: grassland

Fraction of dominant landcover type [%]:

60.0


Radius: 2 km

Number of landcover classes:

4

Dominant landcover type:

130: grassland

Fraction of dominant landcover type [%]:

46.0


Radius: 5 km

Number of landcover classes:

5

Dominant landcover type:

130: grassland

Fraction of dominant landcover type [%]:

46.0


Radius: 10 km

Number of landcover classes:

5

Dominant landcover type:

130: grassland

Fraction of dominant landcover type [%]:

49.0


Radius: 20 km

Number of landcover classes:

5

Dominant landcover type:

130: grassland

Fraction of dominant landcover type [%]:

40.0


Disturbances


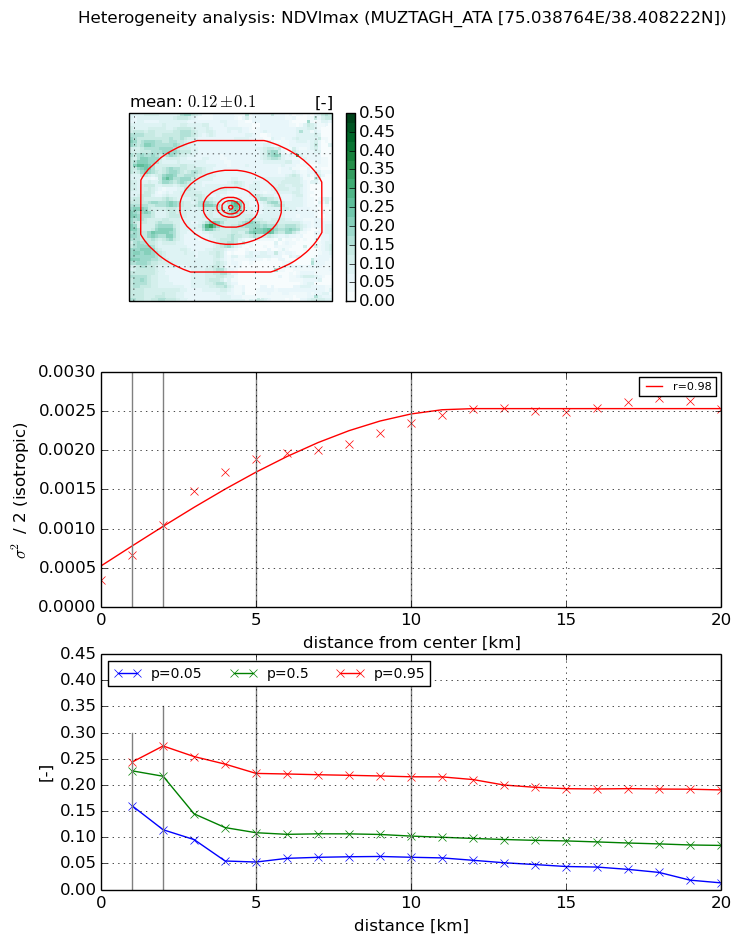
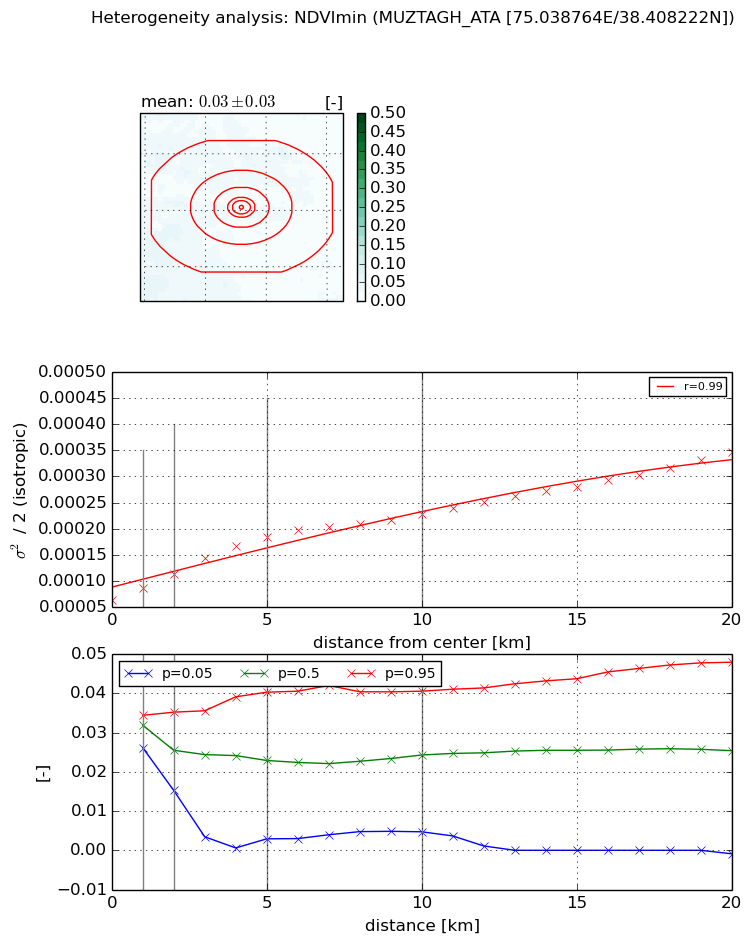
Heterogeneity analysis

The heterogeneity analysis provides information about the spatial and temporal heterogeneity of the site.

Topography


Roman et al. (2009) index


St

12.1677158234

Rcv

-0.105926778352

Rse

0.0

Rst

-0.0198370347939

Rsv

-0.120790268453


Height range @ 1km [m]

225

Height range @ 2km [m]

545

Height range @ 5km [m]

632

Height range @ 10km [m]

-999

Height range @ 20km [m]

-999


Variance slope @ 1 km

13419

Variance slope @ 2 km

15942

Variance slope @ 5 km

13466

Variance slope @ 10 km

-999

Variance slope @ 20 km

-999


NDVI (max. NDVI composite)


Roman et al. (2009) index


St

3.59286896443

Rcv

0.255514453474

Rse

0.0

Rst

-0.256140419252

Rsv

0.323332439559


NDVI range @ 1km [-]

0.08

NDVI range @ 2km [-]

0.16

NDVI range @ 5km [-]

0.17

NDVI range @ 10km [-]

0.15

NDVI range @ 20km [-]

0.18


Variance slope @ 1 km

0.000322518151467

Variance slope @ 2 km

0.0003524917125

Variance slope @ 5 km

0.000322549220534

Variance slope @ 10 km

0.000187319189207

Variance slope @ 20 km

9.47769478671e-05


NDVI (min. NDVI composite)I


Roman et al. (2009) index


St

6.97212530663e-08

Rcv

0.127411986866

Rse

0.0

Rst

0.281034160554

Rsv

43028486.1442


NDVI range @ 1km [-]

0.01

NDVI range @ 2km [-]

0.02

NDVI range @ 5km [-]

0.04

NDVI range @ 10km [-]

0.04

NDVI range @ 20km [-]

0.05


NDVI slope @ 1 km

2.27315132921e-05

NDVI slope @ 2 km

2.44697463205e-05

NDVI slope @ 5 km

2.51086554831e-05

NDVI slope @ 10 km

1.62101885516e-05

NDVI slope @ 20 km

1.24489440802e-05


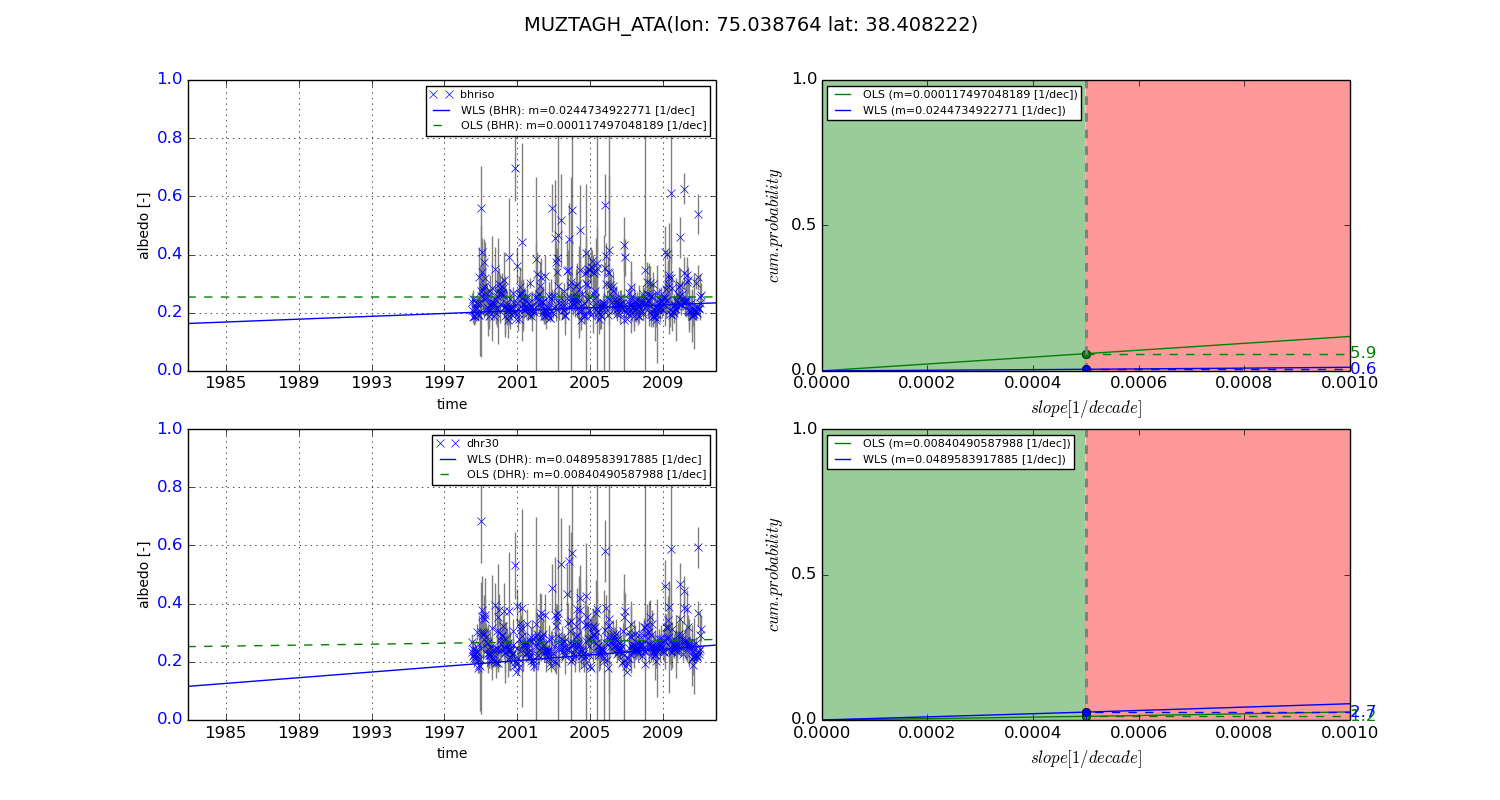
Temporal stability analysis

+000 deg (BHR)


BHR statistics

Temporal stability [1/decade]:


abs

rel


Weighted least square:

-99999.0


Ordinary least square:

-99999.0


Probabilities that GCOS criteria is met:

Weighted least square:

-99999.0 %

Ordinary least square:

-99999.0 %


DHR statistics

Temporal stability [1/decade]:


abs

rel


Weighted least square:

-99999.0


Ordinary least square:

-99999.0


Probabilities that GCOS criteria is met:

Weighted least square:

-99999.0 %

Ordinary least square:

-99999.0 %


+057/+063 deg (BHR)


BHR statistics

Temporal stability [1/decade]:


abs

rel


Weighted least square:

0.0244734922771


Ordinary least square:

0.000117497048189


Probabilities that GCOS criteria is met:

Weighted least square:

0.6 %

Ordinary least square:

5.9 %


DHR statistics

Temporal stability [1/decade]:


abs

rel


Weighted least square:

0.0489583917885


Ordinary least square:

0.00840490587988


Probabilities that GCOS criteria is met:

Weighted least square:

2.7 %

Ordinary least square:

1.2 %


Temporal anomaly analyis

The variance of the temporal anomalies provides an additional measure about the stability of the signal AFTER removal of the mean seasonal cylce.
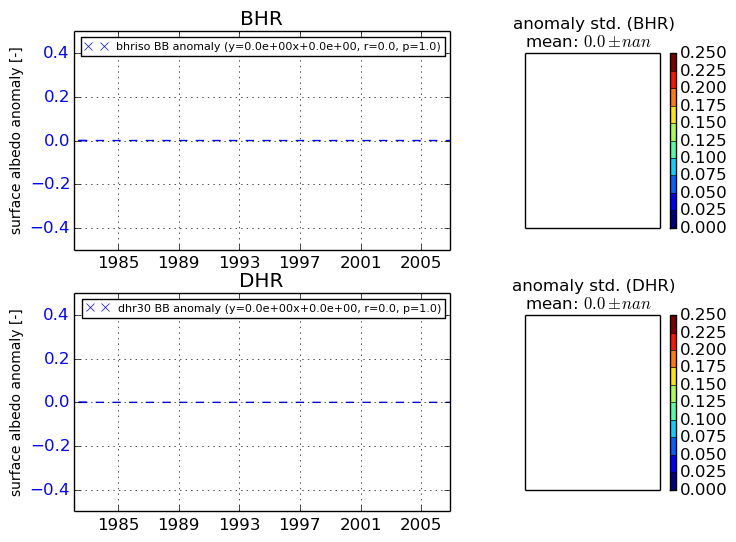
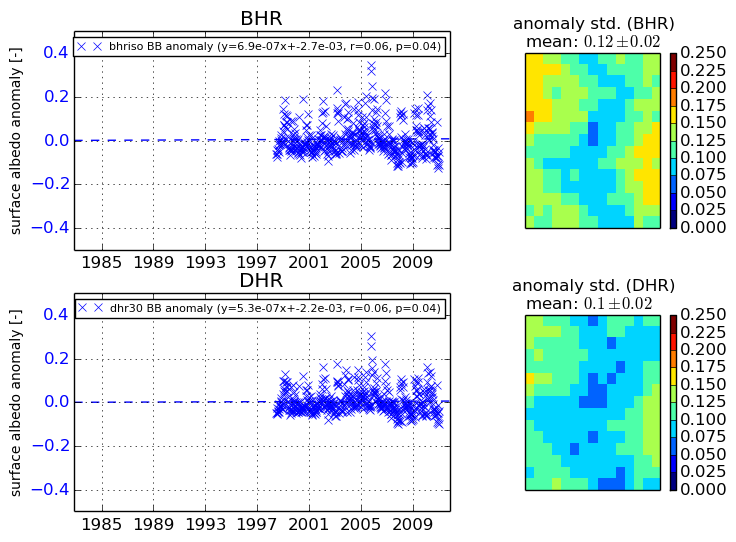
+000 deg


+057/+063 deg