NAIROBI


Location

lon / lat [deg]: 36.8653 / -1.3389

Source network: AERONET


Geostationary surface albedo (GSA) data


“+000”


“+057/+063”


Landcover information (based on ESA CCI landcover data)


Landcover fractions @ 2km distance


Landcover fractions @ 20 km distance


Legend


Distance to open water bodies [km]:

18.73

Distance to urban areas [km]:

0.15


Radius: 1 km

Number of landcover classes:

2

Dominant landcover type:

190: urban areas

Fraction of dominant landcover type [%]:

53.0


Radius: 2 km

Number of landcover classes:

3

Dominant landcover type:

190: urban areas

Fraction of dominant landcover type [%]:

57.0


Radius: 5 km

Number of landcover classes:

4

Dominant landcover type:

190: urban areas

Fraction of dominant landcover type [%]:

51.0


Radius: 10 km

Number of landcover classes:

5

Dominant landcover type:

190: urban areas

Fraction of dominant landcover type [%]:

47.0


Radius: 20 km

Number of landcover classes:

6

Dominant landcover type:

10: cropland, rainfed

Fraction of dominant landcover type [%]:

48.0


Disturbances


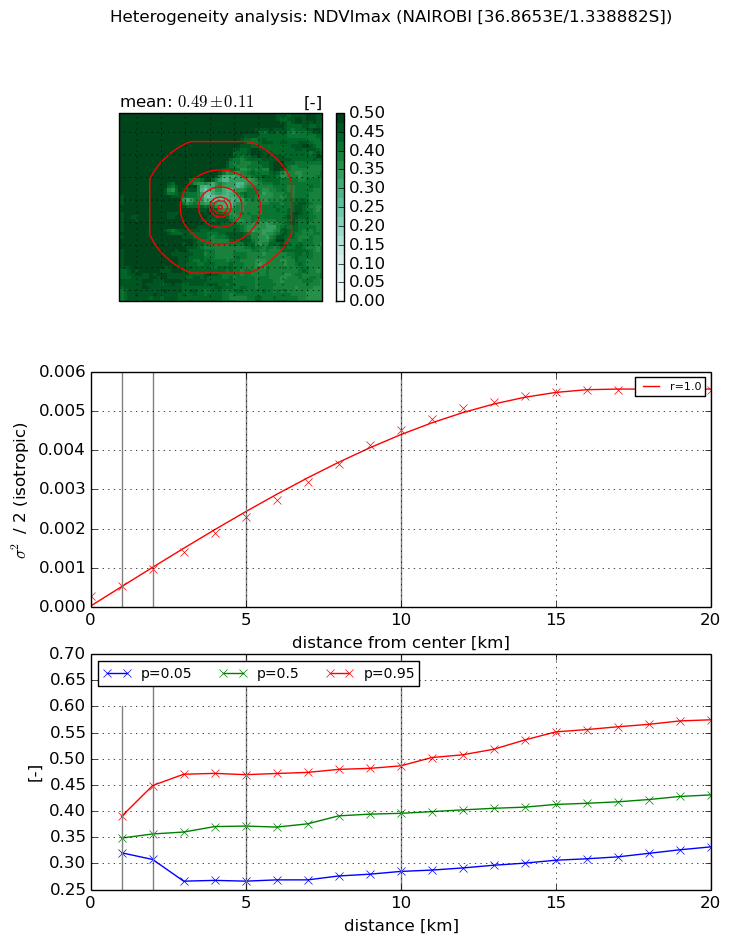
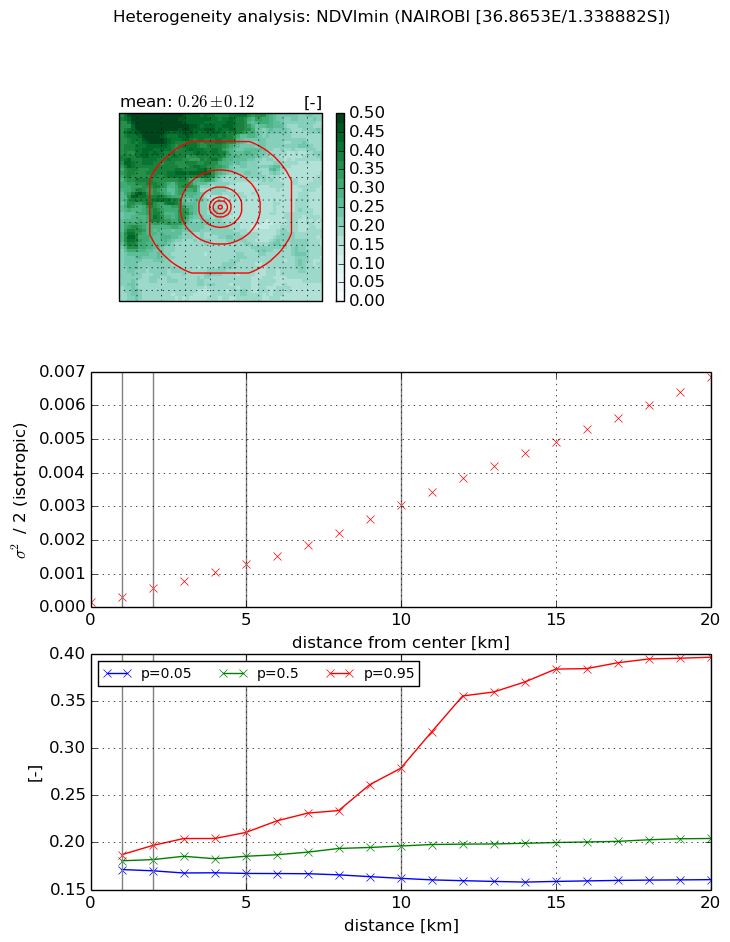
Heterogeneity analysis

The heterogeneity analysis provides information about the spatial and temporal heterogeneity of the site.

Topography


Roman et al. (2009) index


St

8.44433928337e-07

Rcv

0.602076133204

Rse

0.0

Rst

0.000493530145987

Rsv

3552675.21886


Height range @ 1km [m]

11

Height range @ 2km [m]

14

Height range @ 5km [m]

38

Height range @ 10km [m]

-999

Height range @ 20km [m]

-999


Variance slope @ 1 km

36

Variance slope @ 2 km

31

Variance slope @ 5 km

34

Variance slope @ 10 km

-999

Variance slope @ 20 km

-999


NDVI (max. NDVI composite)


Roman et al. (2009) index


St

7.74013434592e-07

Rcv

0.00715387510917

Rse

0.0

Rst

0.306481496128

Rsv

3875901.40321


NDVI range @ 1km [-]

0.07

NDVI range @ 2km [-]

0.14

NDVI range @ 5km [-]

0.2

NDVI range @ 10km [-]

0.2

NDVI range @ 20km [-]

0.24


Variance slope @ 1 km

0.000251091481841

Variance slope @ 2 km

0.000346732004344

Variance slope @ 5 km

0.000415518192715

Variance slope @ 10 km

0.000434489384793

Variance slope @ 20 km

0.000286380965728


NDVI (min. NDVI composite)I


Roman et al. (2009) index


St

0.00291924743924

Rcv

0.235080120894

Rse

0.0

Rst

7.39481007948e-05

Rsv

1027.42696175


NDVI range @ 1km [-]

0.02

NDVI range @ 2km [-]

0.03

NDVI range @ 5km [-]

0.04

NDVI range @ 10km [-]

0.12

NDVI range @ 20km [-]

0.24


NDVI slope @ 1 km

0.000144631630757

NDVI slope @ 2 km

0.000197030438837

NDVI slope @ 5 km

0.000226744634754

NDVI slope @ 10 km

0.000282650946864

NDVI slope @ 20 km

0.000345839382325


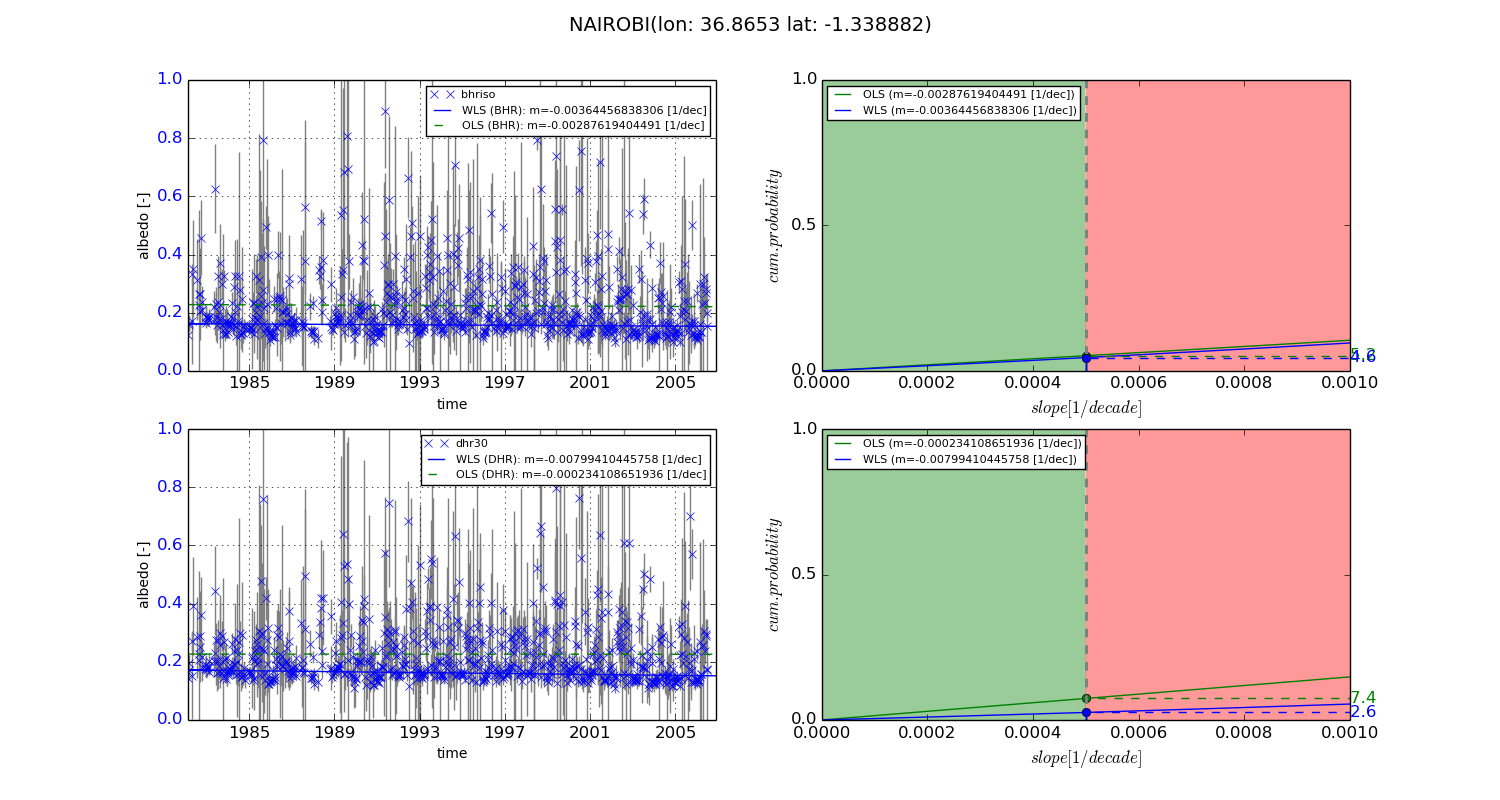
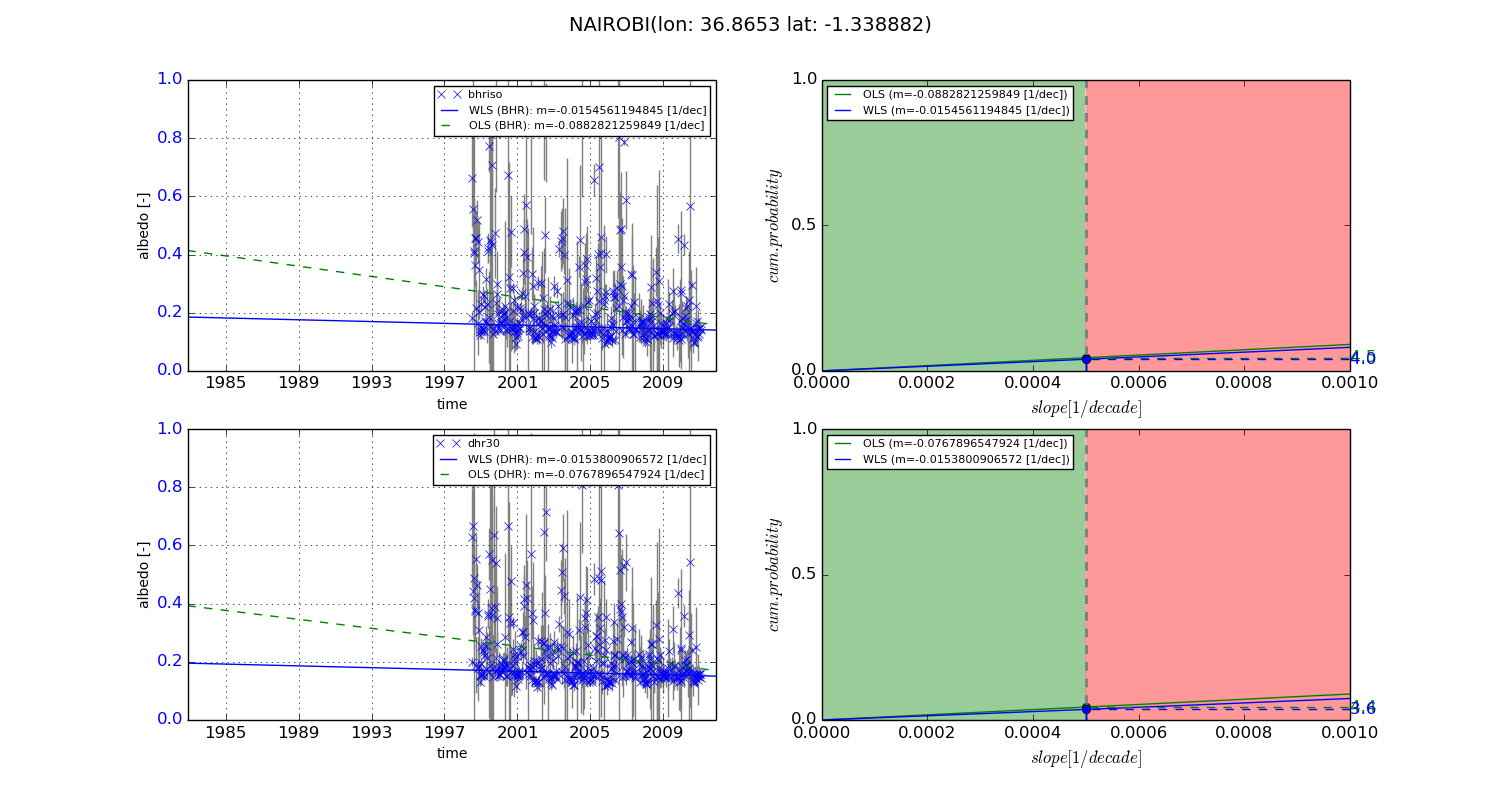
Temporal stability analysis

+000 deg (BHR)


BHR statistics

Temporal stability [1/decade]:


abs

rel


Weighted least square:

-0.00364456838306


Ordinary least square:

-0.00287619404491


Probabilities that GCOS criteria is met:

Weighted least square:

4.6 %

Ordinary least square:

5.2 %


DHR statistics

Temporal stability [1/decade]:


abs

rel


Weighted least square:

-0.00799410445758


Ordinary least square:

-0.000234108651936


Probabilities that GCOS criteria is met:

Weighted least square:

2.6 %

Ordinary least square:

7.4 %


+057/+063 deg (BHR)


BHR statistics

Temporal stability [1/decade]:


abs

rel


Weighted least square:

-0.0154561194845


Ordinary least square:

-0.0882821259849


Probabilities that GCOS criteria is met:

Weighted least square:

4.0 %

Ordinary least square:

4.5 %


DHR statistics

Temporal stability [1/decade]:


abs

rel


Weighted least square:

-0.0153800906572


Ordinary least square:

-0.0767896547924


Probabilities that GCOS criteria is met:

Weighted least square:

3.6 %

Ordinary least square:

4.4 %


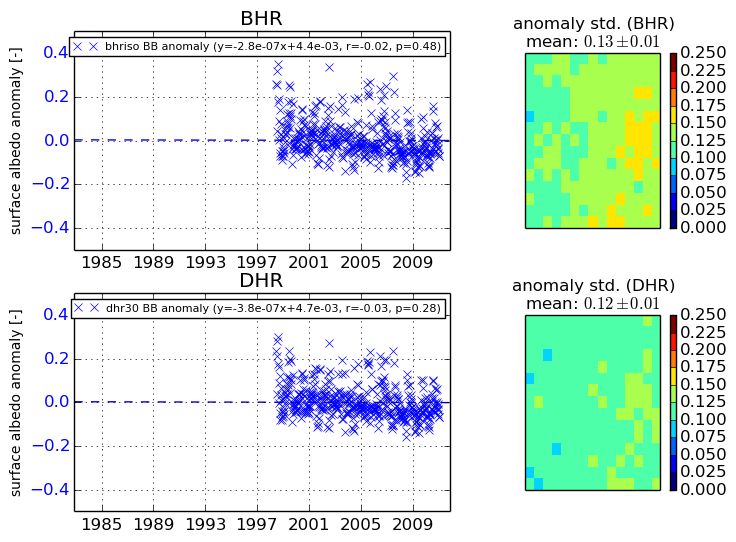
Temporal anomaly analyis

The variance of the temporal anomalies provides an additional measure about the stability of the signal AFTER removal of the mean seasonal cylce.
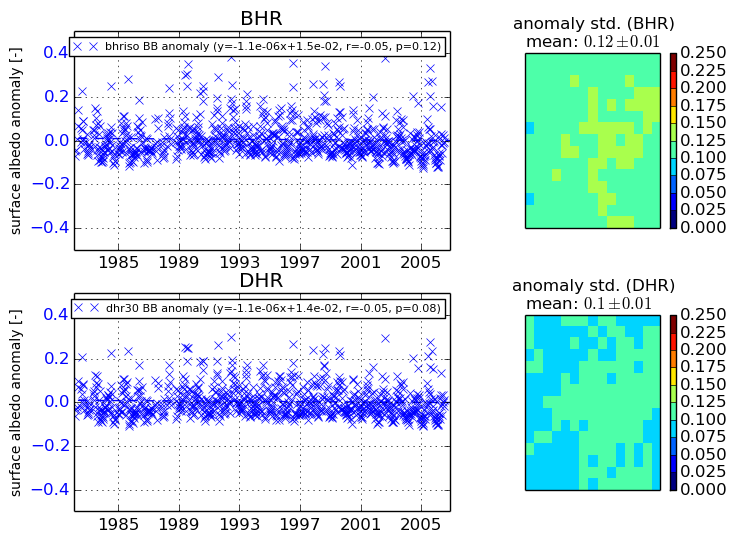
+000 deg


+057/+063 deg