NAM_CO


Location

lon / lat [deg]: 90.9624 / 30.7725

Source network: AERONET


Geostationary surface albedo (GSA) data


“+000”


“+057/+063”


Landcover information (based on ESA CCI landcover data)


Landcover fractions @ 2km distance


Landcover fractions @ 20 km distance


Legend


Distance to open water bodies [km]:

0.43

Distance to urban areas [km]:

none in region


Radius: 1 km

Number of landcover classes:

2

Dominant landcover type:

130: grassland

Fraction of dominant landcover type [%]:

74.0


Radius: 2 km

Number of landcover classes:

2

Dominant landcover type:

130: grassland

Fraction of dominant landcover type [%]:

84.0


Radius: 5 km

Number of landcover classes:

2

Dominant landcover type:

130: grassland

Fraction of dominant landcover type [%]:

56.0


Radius: 10 km

Number of landcover classes:

2

Dominant landcover type:

130: grassland

Fraction of dominant landcover type [%]:

54.0


Radius: 20 km

Number of landcover classes:

4

Dominant landcover type:

130: grassland

Fraction of dominant landcover type [%]:

57.0


Disturbances


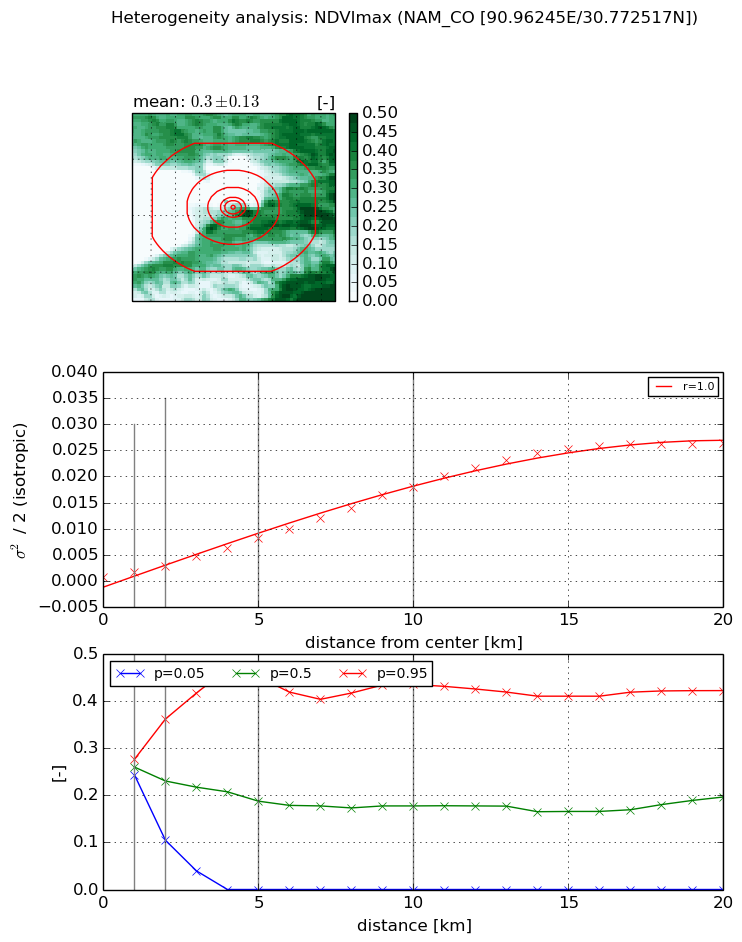
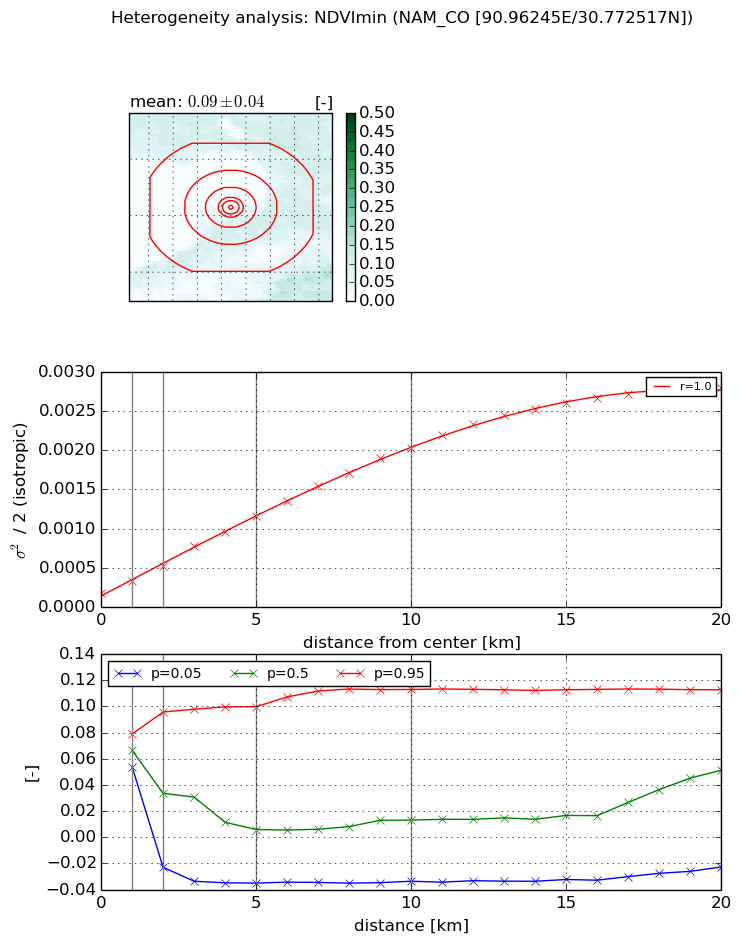
Heterogeneity analysis

The heterogeneity analysis provides information about the spatial and temporal heterogeneity of the site.

Topography


Roman et al. (2009) index


St

0.00180175257271

Rcv

0.905523368194

Rse

0.0

Rst

7.41089516085e-06

Rsv

1664.13996184


Height range @ 1km [m]

18

Height range @ 2km [m]

18

Height range @ 5km [m]

46

Height range @ 10km [m]

-999

Height range @ 20km [m]

-999


Variance slope @ 1 km

58

Variance slope @ 2 km

59

Variance slope @ 5 km

64

Variance slope @ 10 km

-999

Variance slope @ 20 km

-999


NDVI (max. NDVI composite)


Roman et al. (2009) index


St

4.20769590885e-07

Rcv

0.497466910015

Rse

0.0

Rst

0.298054917481

Rsv

7129792.00554


NDVI range @ 1km [-]

0.03

NDVI range @ 2km [-]

0.26

NDVI range @ 5km [-]

0.45

NDVI range @ 10km [-]

0.44

NDVI range @ 20km [-]

0.42


Variance slope @ 1 km

0.000886060534029

Variance slope @ 2 km

0.0010589739385

Variance slope @ 5 km

0.00150689661975

Variance slope @ 10 km

0.0017994562222

Variance slope @ 20 km

0.00146425548281


NDVI (min. NDVI composite)I


Roman et al. (2009) index


St

5.42893807512

Rcv

0.203274319451

Rse

0.0

Rst

-0.0964454198108

Rsv

0.252874517385


NDVI range @ 1km [-]

0.03

NDVI range @ 2km [-]

0.12

NDVI range @ 5km [-]

0.13

NDVI range @ 10km [-]

0.15

NDVI range @ 20km [-]

0.14


NDVI slope @ 1 km

0.00014946923611

NDVI slope @ 2 km

0.000168304841362

NDVI slope @ 5 km

0.000202014977478

NDVI slope @ 10 km

0.000191087872366

NDVI slope @ 20 km

0.00013759243375


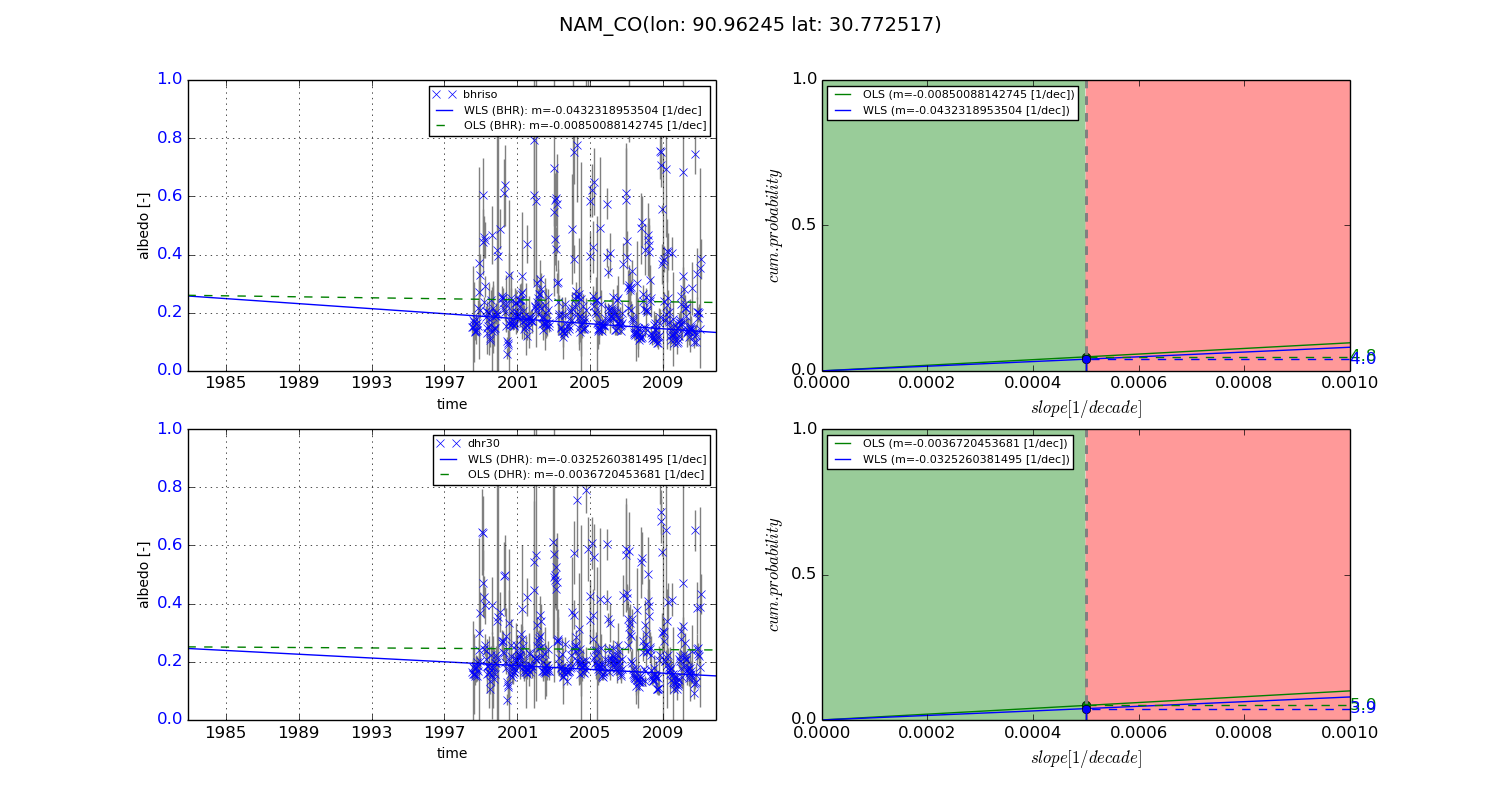
Temporal stability analysis

+000 deg (BHR)


BHR statistics

Temporal stability [1/decade]:


abs

rel


Weighted least square:

None


Ordinary least square:

None


Probabilities that GCOS criteria is met:

Weighted least square:

None %

Ordinary least square:

None %


DHR statistics

Temporal stability [1/decade]:


abs

rel


Weighted least square:

None


Ordinary least square:

None


Probabilities that GCOS criteria is met:

Weighted least square:

None %

Ordinary least square:

None %


+057/+063 deg (BHR)


BHR statistics

Temporal stability [1/decade]:


abs

rel


Weighted least square:

-0.0432318953504


Ordinary least square:

-0.00850088142745


Probabilities that GCOS criteria is met:

Weighted least square:

4.0 %

Ordinary least square:

4.8 %


DHR statistics

Temporal stability [1/decade]:


abs

rel


Weighted least square:

-0.0325260381495


Ordinary least square:

-0.0036720453681


Probabilities that GCOS criteria is met:

Weighted least square:

3.9 %

Ordinary least square:

5.0 %


Temporal anomaly analyis

The variance of the temporal anomalies provides an additional measure about the stability of the signal AFTER removal of the mean seasonal cylce.

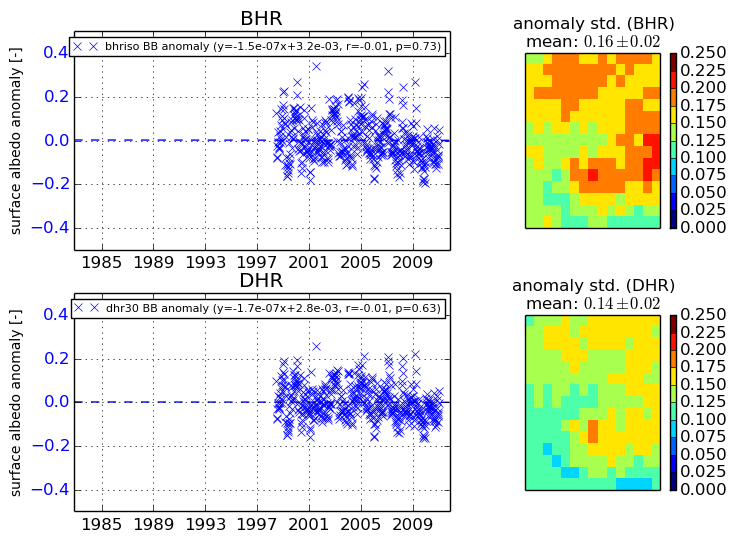
+000 deg


+057/+063 deg