NCAR


Location

lon / lat [deg]: -105.2428 / 40.0375

Source network: AERONET


Geostationary surface albedo (GSA) data


“+000”


“+057/+063”


Landcover information (based on ESA CCI landcover data)


Landcover fractions @ 2km distance


Landcover fractions @ 20 km distance


Legend


Distance to open water bodies [km]:

2.13

Distance to urban areas [km]:

0.02


Radius: 1 km

Number of landcover classes:

2

Dominant landcover type:

190: urban areas

Fraction of dominant landcover type [%]:

98.0


Radius: 2 km

Number of landcover classes:

2

Dominant landcover type:

190: urban areas

Fraction of dominant landcover type [%]:

75.0


Radius: 5 km

Number of landcover classes:

4

Dominant landcover type:

190: urban areas

Fraction of dominant landcover type [%]:

65.0


Radius: 10 km

Number of landcover classes:

5

Dominant landcover type:

130: grassland

Fraction of dominant landcover type [%]:

42.0


Radius: 20 km

Number of landcover classes:

5

Dominant landcover type:

130: grassland

Fraction of dominant landcover type [%]:

41.0


Disturbances


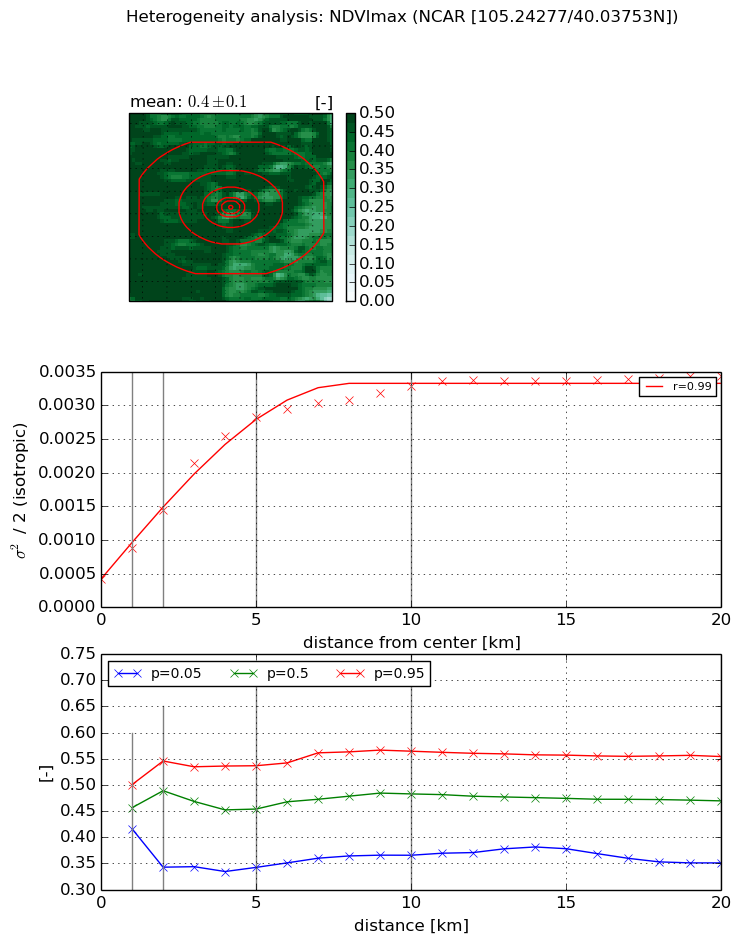
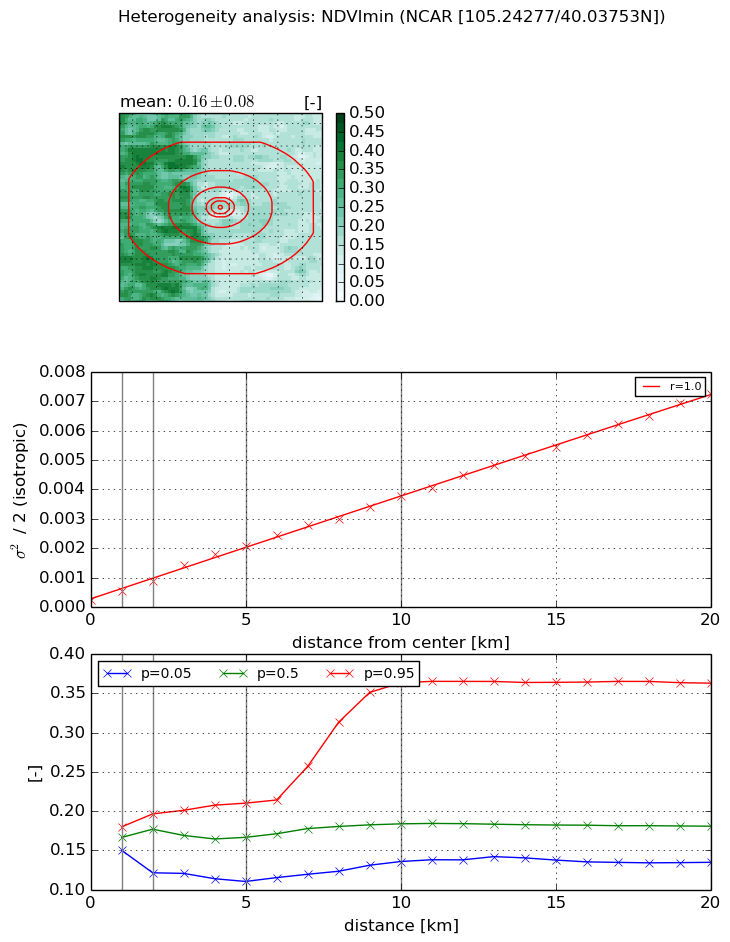
Heterogeneity analysis

The heterogeneity analysis provides information about the spatial and temporal heterogeneity of the site.

Topography


Roman et al. (2009) index


St

1.9829858198

Rcv

1.08915522815

Rse

0.0

Rst

-5.1068169064e-06

Rsv

-0.423709787477


Height range @ 1km [m]

21

Height range @ 2km [m]

48

Height range @ 5km [m]

123

Height range @ 10km [m]

-999

Height range @ 20km [m]

-999


Variance slope @ 1 km

865

Variance slope @ 2 km

898

Variance slope @ 5 km

825

Variance slope @ 10 km

-999

Variance slope @ 20 km

-999


NDVI (max. NDVI composite)


Roman et al. (2009) index


St

4.88697495637

Rcv

-0.0543732781233

Rse

0.0

Rst

0.167776919162

Rsv

-0.391726490601


NDVI range @ 1km [-]

0.08

NDVI range @ 2km [-]

0.2

NDVI range @ 5km [-]

0.19

NDVI range @ 10km [-]

0.2

NDVI range @ 20km [-]

0.2


Variance slope @ 1 km

0.000457497898324

Variance slope @ 2 km

0.000515786267106

Variance slope @ 5 km

0.000507180258192

Variance slope @ 10 km

0.00027920716914

Variance slope @ 20 km

0.000115446957847


NDVI (min. NDVI composite)I


Roman et al. (2009) index


St

1.87187889905

Rcv

0.224484454741

Rse

0.0

Rst

-0.386665197809

Rsv

0.991518127677


NDVI range @ 1km [-]

0.03

NDVI range @ 2km [-]

0.08

NDVI range @ 5km [-]

0.1

NDVI range @ 10km [-]

0.23

NDVI range @ 20km [-]

0.23


NDVI slope @ 1 km

0.000295776209955

NDVI slope @ 2 km

0.000323204500134

NDVI slope @ 5 km

0.00038931685463

NDVI slope @ 10 km

0.000354323927716

NDVI slope @ 20 km

0.000347520342381


Temporal stability analysis

+000 deg (BHR)


BHR statistics

Temporal stability [1/decade]:


abs

rel


Weighted least square:

None


Ordinary least square:

None


Probabilities that GCOS criteria is met:

Weighted least square:

None %

Ordinary least square:

None %


DHR statistics

Temporal stability [1/decade]:


abs

rel


Weighted least square:

None


Ordinary least square:

None


Probabilities that GCOS criteria is met:

Weighted least square:

None %

Ordinary least square:

None %


+057/+063 deg (BHR)


BHR statistics

Temporal stability [1/decade]:


abs

rel


Weighted least square:

None


Ordinary least square:

None


Probabilities that GCOS criteria is met:

Weighted least square:

None %

Ordinary least square:

None %


DHR statistics

Temporal stability [1/decade]:


abs

rel


Weighted least square:

None


Ordinary least square:

None


Probabilities that GCOS criteria is met:

Weighted least square:

None %

Ordinary least square:

None %


Temporal anomaly analyis

The variance of the temporal anomalies provides an additional measure about the stability of the signal AFTER removal of the mean seasonal cylce.

+000 deg


+057/+063 deg