NEON-BOULDER


Location

lon / lat [deg]: -105.2682 / 40.0079

Source network: AERONET


Geostationary surface albedo (GSA) data


“+000”


“+057/+063”


Landcover information (based on ESA CCI landcover data)


Landcover fractions @ 2km distance


Landcover fractions @ 20 km distance


Legend


Distance to open water bodies [km]:

4.87

Distance to urban areas [km]:

0.1


Radius: 1 km

Number of landcover classes:

1

Dominant landcover type:

190: urban areas

Fraction of dominant landcover type [%]:

100.0


Radius: 2 km

Number of landcover classes:

1

Dominant landcover type:

190: urban areas

Fraction of dominant landcover type [%]:

100.0


Radius: 5 km

Number of landcover classes:

3

Dominant landcover type:

190: urban areas

Fraction of dominant landcover type [%]:

76.0


Radius: 10 km

Number of landcover classes:

4

Dominant landcover type:

70: Tree cover, needleleaved, evergreen, closed to open (>15%)

Fraction of dominant landcover type [%]:

35.0


Radius: 20 km

Number of landcover classes:

5

Dominant landcover type:

70: Tree cover, needleleaved, evergreen, closed to open (>15%)

Fraction of dominant landcover type [%]:

42.0


Disturbances


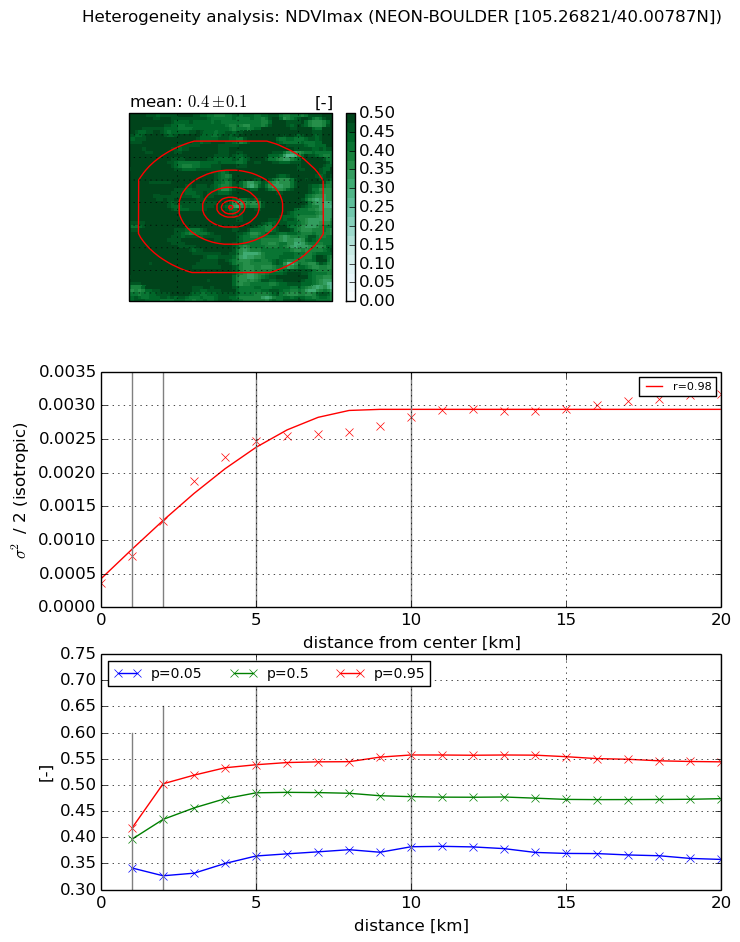
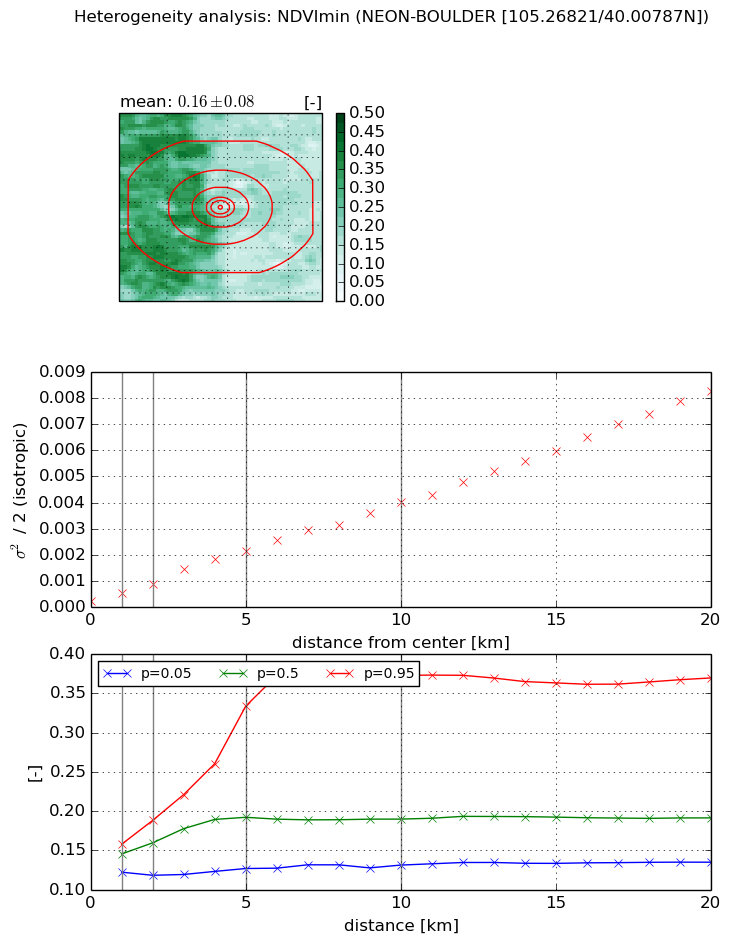
Heterogeneity analysis

The heterogeneity analysis provides information about the spatial and temporal heterogeneity of the site.

Topography


Roman et al. (2009) index


St

2.65784980886

Rcv

0.95177587807

Rse

0.0

Rst

-7.75723130859e-08

Rsv

0.176955995277


Height range @ 1km [m]

63

Height range @ 2km [m]

132

Height range @ 5km [m]

559

Height range @ 10km [m]

-999

Height range @ 20km [m]

-999


Variance slope @ 1 km

4240

Variance slope @ 2 km

5340

Variance slope @ 5 km

7644

Variance slope @ 10 km

-999

Variance slope @ 20 km

-999


NDVI (max. NDVI composite)


Roman et al. (2009) index


St

4.3202806408

Rcv

-0.140637466025

Rse

0.0

Rst

0.449643619264

Rsv

-0.104118248789


NDVI range @ 1km [-]

0.08

NDVI range @ 2km [-]

0.18

NDVI range @ 5km [-]

0.17

NDVI range @ 10km [-]

0.18

NDVI range @ 20km [-]

0.19


Variance slope @ 1 km

0.000401764587996

Variance slope @ 2 km

0.000454219462362

Variance slope @ 5 km

0.000442731918595

Variance slope @ 10 km

0.000234009830824

Variance slope @ 20 km

0.000107736938424


NDVI (min. NDVI composite)I


Roman et al. (2009) index


St

nan

Rcv

nan

Rse

nan

Rst

nan

Rsv

nan


NDVI range @ 1km [-]

0.04

NDVI range @ 2km [-]

0.07

NDVI range @ 5km [-]

0.21

NDVI range @ 10km [-]

0.24

NDVI range @ 20km [-]

0.23


NDVI slope @ 1 km

0.000303124033386

NDVI slope @ 2 km

0.000328502020518

NDVI slope @ 5 km

0.000396406098121

NDVI slope @ 10 km

0.000377580867029

NDVI slope @ 20 km

0.000399149400483


Temporal stability analysis

+000 deg (BHR)


BHR statistics

Temporal stability [1/decade]:


abs

rel


Weighted least square:

None


Ordinary least square:

None


Probabilities that GCOS criteria is met:

Weighted least square:

None %

Ordinary least square:

None %


DHR statistics

Temporal stability [1/decade]:


abs

rel


Weighted least square:

None


Ordinary least square:

None


Probabilities that GCOS criteria is met:

Weighted least square:

None %

Ordinary least square:

None %


+057/+063 deg (BHR)


BHR statistics

Temporal stability [1/decade]:


abs

rel


Weighted least square:

None


Ordinary least square:

None


Probabilities that GCOS criteria is met:

Weighted least square:

None %

Ordinary least square:

None %


DHR statistics

Temporal stability [1/decade]:


abs

rel


Weighted least square:

None


Ordinary least square:

None


Probabilities that GCOS criteria is met:

Weighted least square:

None %

Ordinary least square:

None %


Temporal anomaly analyis

The variance of the temporal anomalies provides an additional measure about the stability of the signal AFTER removal of the mean seasonal cylce.

+000 deg


+057/+063 deg