NEON-CASTNET


Location

lon / lat [deg]: -105.5425 / 40.2786

Source network: AERONET


Geostationary surface albedo (GSA) data


“+000”


“+057/+063”


Landcover information (based on ESA CCI landcover data)


Landcover fractions @ 2km distance


Landcover fractions @ 20 km distance


Legend


Distance to open water bodies [km]:

6.76

Distance to urban areas [km]:

1.19


Radius: 1 km

Number of landcover classes:

1

Dominant landcover type:

70: Tree cover, needleleaved, evergreen, closed to open (>15%)

Fraction of dominant landcover type [%]:

100.0


Radius: 2 km

Number of landcover classes:

1

Dominant landcover type:

70: Tree cover, needleleaved, evergreen, closed to open (>15%)

Fraction of dominant landcover type [%]:

99.0


Radius: 5 km

Number of landcover classes:

3

Dominant landcover type:

70: Tree cover, needleleaved, evergreen, closed to open (>15%)

Fraction of dominant landcover type [%]:

92.0


Radius: 10 km

Number of landcover classes:

5

Dominant landcover type:

70: Tree cover, needleleaved, evergreen, closed to open (>15%)

Fraction of dominant landcover type [%]:

83.0


Radius: 20 km

Number of landcover classes:

6

Dominant landcover type:

70: Tree cover, needleleaved, evergreen, closed to open (>15%)

Fraction of dominant landcover type [%]:

79.0


Disturbances


Heterogeneity analysis

The heterogeneity analysis provides information about the spatial and temporal heterogeneity of the site.

Topography


Roman et al. (2009) index


St

2.59570173864

Rcv

0.339076313958

Rse

0.0

Rst

-0.0730827795468

Rsv

0.743597731459


Height range @ 1km [m]

142

Height range @ 2km [m]

396

Height range @ 5km [m]

852

Height range @ 10km [m]

-999

Height range @ 20km [m]

-999


Variance slope @ 1 km

15528

Variance slope @ 2 km

20112

Variance slope @ 5 km

20498

Variance slope @ 10 km

-999

Variance slope @ 20 km

-999


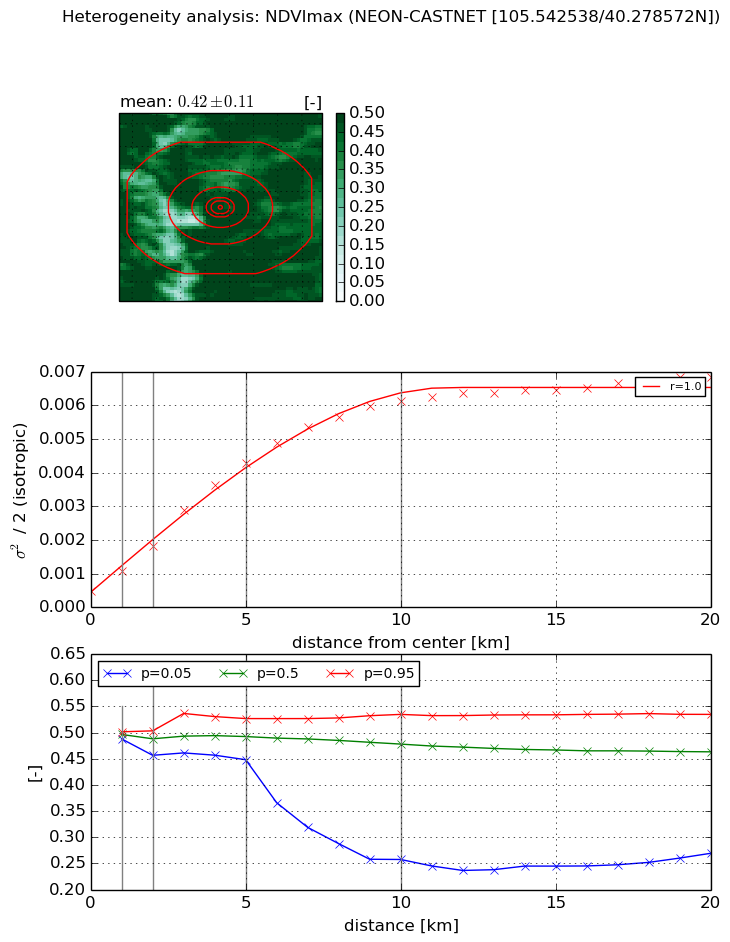
NDVI (max. NDVI composite)


Roman et al. (2009) index


St

4.69242803157

Rcv

0.150117752253

Rse

0.0

Rst

-0.318396714803

Rsv

0.17081339899


NDVI range @ 1km [-]

0.01

NDVI range @ 2km [-]

0.05

NDVI range @ 5km [-]

0.08

NDVI range @ 10km [-]

0.28

NDVI range @ 20km [-]

0.27


Variance slope @ 1 km

0.00060532388539

Variance slope @ 2 km

0.000666944233299

Variance slope @ 5 km

0.000790801837921

Variance slope @ 10 km

0.000596426045648

Variance slope @ 20 km

0.000285995994333


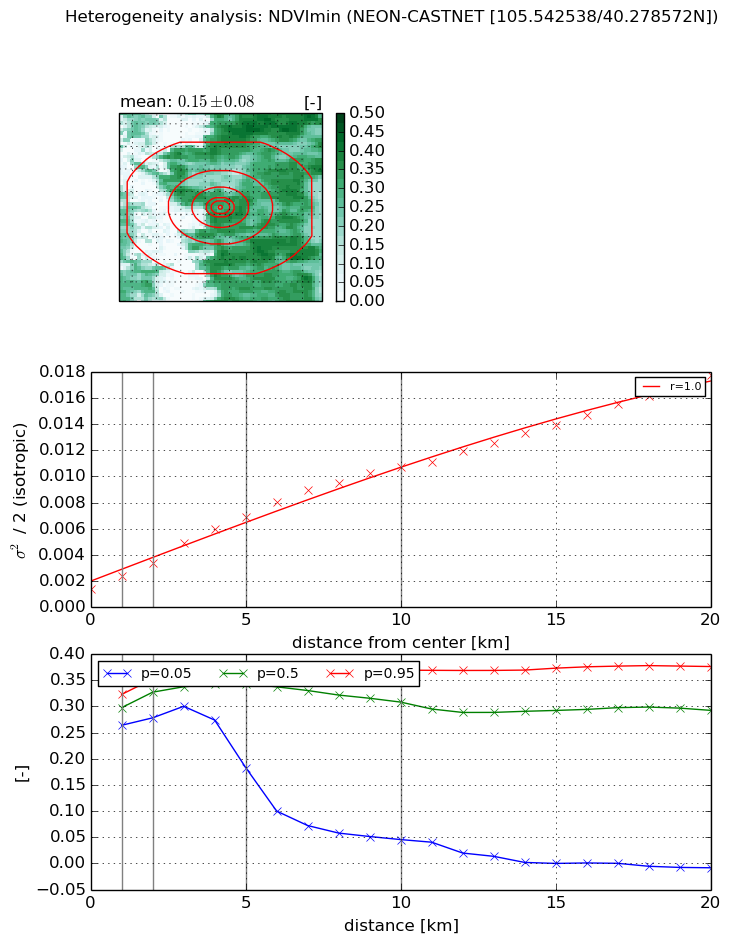
NDVI (min. NDVI composite)I


Roman et al. (2009) index


St

0.664978011166

Rcv

1.52058136034

Rse

0.0

Rst

-0.267361735415

Rsv

2.72348427421


NDVI range @ 1km [-]

0.06

NDVI range @ 2km [-]

0.07

NDVI range @ 5km [-]

0.19

NDVI range @ 10km [-]

0.32

NDVI range @ 20km [-]

0.38


NDVI slope @ 1 km

0.000950703982205

NDVI slope @ 2 km

0.00100083919976

NDVI slope @ 5 km

0.0011411190055

NDVI slope @ 10 km

0.000970695094231

NDVI slope @ 20 km

0.000777267972146


Temporal stability analysis

+000 deg (BHR)


BHR statistics

Temporal stability [1/decade]:


abs

rel


Weighted least square:

None


Ordinary least square:

None


Probabilities that GCOS criteria is met:

Weighted least square:

None %

Ordinary least square:

None %


DHR statistics

Temporal stability [1/decade]:


abs

rel


Weighted least square:

None


Ordinary least square:

None


Probabilities that GCOS criteria is met:

Weighted least square:

None %

Ordinary least square:

None %


+057/+063 deg (BHR)


BHR statistics

Temporal stability [1/decade]:


abs

rel


Weighted least square:

None


Ordinary least square:

None


Probabilities that GCOS criteria is met:

Weighted least square:

None %

Ordinary least square:

None %


DHR statistics

Temporal stability [1/decade]:


abs

rel


Weighted least square:

None


Ordinary least square:

None


Probabilities that GCOS criteria is met:

Weighted least square:

None %

Ordinary least square:

None %


Temporal anomaly analyis

The variance of the temporal anomalies provides an additional measure about the stability of the signal AFTER removal of the mean seasonal cylce.

+000 deg


+057/+063 deg