NEON17-SJER


Location

lon / lat [deg]: -119.7221 / 37.0904

Source network: AERONET


Geostationary surface albedo (GSA) data


“+000”


“+057/+063”


Landcover information (based on ESA CCI landcover data)


Landcover fractions @ 2km distance


Landcover fractions @ 20 km distance


Legend


Distance to open water bodies [km]:

7.49

Distance to urban areas [km]:

11.17


Radius: 1 km

Number of landcover classes:

1

Dominant landcover type:

130: grassland

Fraction of dominant landcover type [%]:

100.0


Radius: 2 km

Number of landcover classes:

1

Dominant landcover type:

130: grassland

Fraction of dominant landcover type [%]:

100.0


Radius: 5 km

Number of landcover classes:

1

Dominant landcover type:

130: grassland

Fraction of dominant landcover type [%]:

100.0


Radius: 10 km

Number of landcover classes:

3

Dominant landcover type:

130: grassland

Fraction of dominant landcover type [%]:

94.0


Radius: 20 km

Number of landcover classes:

4

Dominant landcover type:

130: grassland

Fraction of dominant landcover type [%]:

88.0


Disturbances


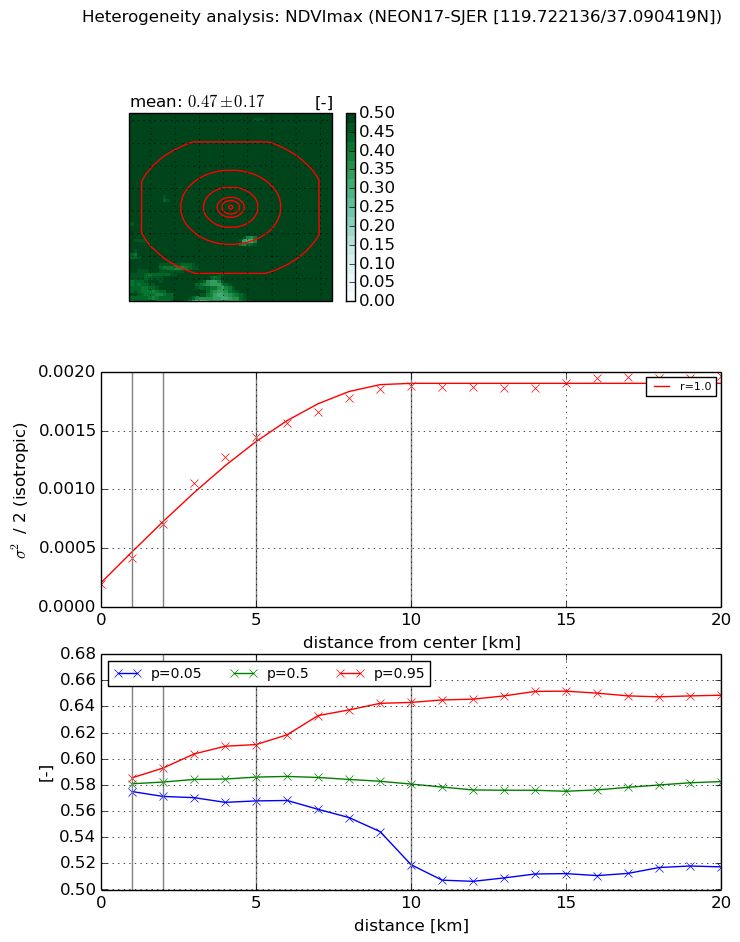
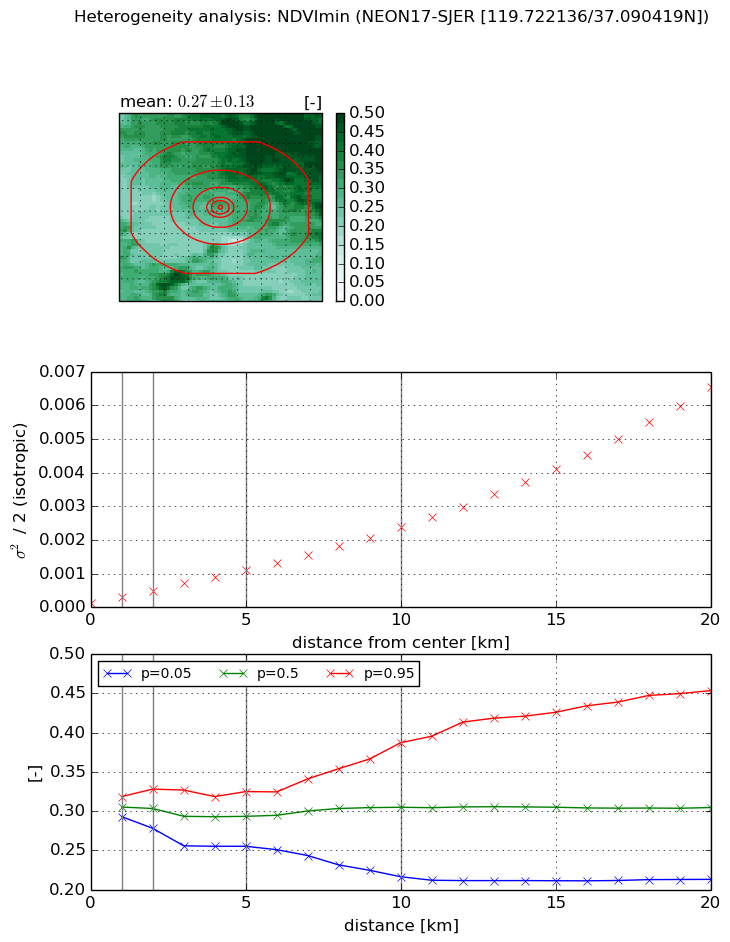
Heterogeneity analysis

The heterogeneity analysis provides information about the spatial and temporal heterogeneity of the site.

Topography


Roman et al. (2009) index


St

2.31781382316

Rcv

0.301728836781

Rse

0.0

Rst

4.42297814751e-07

Rsv

0.992593832647


Height range @ 1km [m]

60

Height range @ 2km [m]

172

Height range @ 5km [m]

257

Height range @ 10km [m]

-999

Height range @ 20km [m]

-999


Variance slope @ 1 km

966

Variance slope @ 2 km

1040

Variance slope @ 5 km

1305

Variance slope @ 10 km

-999

Variance slope @ 20 km

-999


NDVI (max. NDVI composite)


Roman et al. (2009) index


St

9.28856906732

Rcv

0.183356722024

Rse

0.0

Rst

0.0955295788942

Rsv

-0.044091326557


NDVI range @ 1km [-]

0.01

NDVI range @ 2km [-]

0.02

NDVI range @ 5km [-]

0.04

NDVI range @ 10km [-]

0.12

NDVI range @ 20km [-]

0.13


Variance slope @ 1 km

0.000227288965178

Variance slope @ 2 km

0.000255084959029

Variance slope @ 5 km

0.000261466487049

Variance slope @ 10 km

0.000171519769887

Variance slope @ 20 km

7.27064896382e-05


NDVI (min. NDVI composite)I


Roman et al. (2009) index


St

2.81522530204

Rcv

0.0874777719404

Rse

0.0

Rst

-0.232602071647

Rsv

0.745554227626


NDVI range @ 1km [-]

0.03

NDVI range @ 2km [-]

0.05

NDVI range @ 5km [-]

0.07

NDVI range @ 10km [-]

0.17

NDVI range @ 20km [-]

0.24


NDVI slope @ 1 km

0.000158033670513

NDVI slope @ 2 km

0.000171304067842

NDVI slope @ 5 km

0.000199127229191

NDVI slope @ 10 km

0.000220926732603

NDVI slope @ 20 km

0.000311664545597


Temporal stability analysis

+000 deg (BHR)


BHR statistics

Temporal stability [1/decade]:


abs

rel


Weighted least square:

None


Ordinary least square:

None


Probabilities that GCOS criteria is met:

Weighted least square:

None %

Ordinary least square:

None %


DHR statistics

Temporal stability [1/decade]:


abs

rel


Weighted least square:

None


Ordinary least square:

None


Probabilities that GCOS criteria is met:

Weighted least square:

None %

Ordinary least square:

None %


+057/+063 deg (BHR)


BHR statistics

Temporal stability [1/decade]:


abs

rel


Weighted least square:

None


Ordinary least square:

None


Probabilities that GCOS criteria is met:

Weighted least square:

None %

Ordinary least square:

None %


DHR statistics

Temporal stability [1/decade]:


abs

rel


Weighted least square:

None


Ordinary least square:

None


Probabilities that GCOS criteria is met:

Weighted least square:

None %

Ordinary least square:

None %


Temporal anomaly analyis

The variance of the temporal anomalies provides an additional measure about the stability of the signal AFTER removal of the mean seasonal cylce.

+000 deg


+057/+063 deg