NEON_CVALLA


Location

lon / lat [deg]: -105.1672 / 40.1606

Source network: AERONET


Geostationary surface albedo (GSA) data


“+000”


“+057/+063”


Landcover information (based on ESA CCI landcover data)


Landcover fractions @ 2km distance


Landcover fractions @ 20 km distance


Legend


Distance to open water bodies [km]:

1.87

Distance to urban areas [km]:

0.46


Radius: 1 km

Number of landcover classes:

4

Dominant landcover type:

130: grassland

Fraction of dominant landcover type [%]:

52.0


Radius: 2 km

Number of landcover classes:

5

Dominant landcover type:

130: grassland

Fraction of dominant landcover type [%]:

64.0


Radius: 5 km

Number of landcover classes:

6

Dominant landcover type:

130: grassland

Fraction of dominant landcover type [%]:

56.0


Radius: 10 km

Number of landcover classes:

6

Dominant landcover type:

130: grassland

Fraction of dominant landcover type [%]:

62.0


Radius: 20 km

Number of landcover classes:

7

Dominant landcover type:

130: grassland

Fraction of dominant landcover type [%]:

53.0


Disturbances


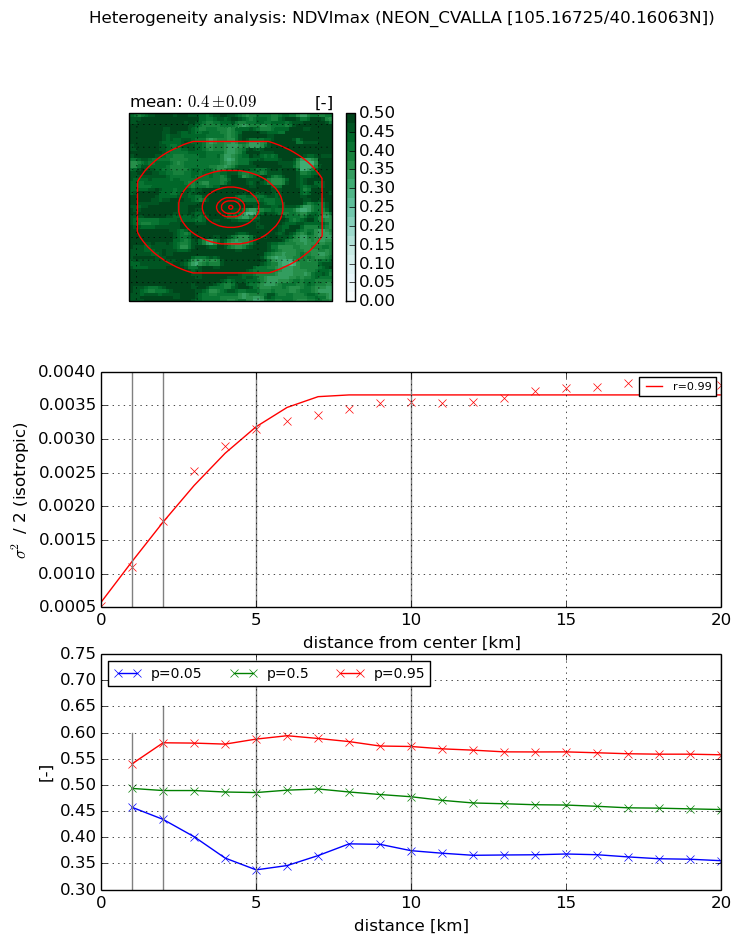
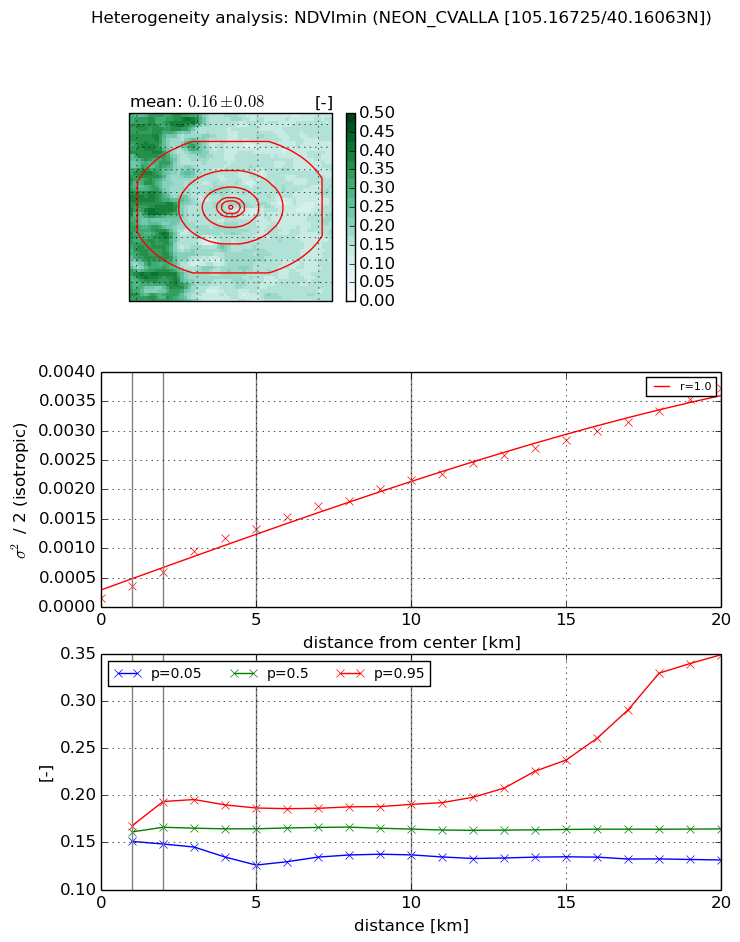
Heterogeneity analysis

The heterogeneity analysis provides information about the spatial and temporal heterogeneity of the site.

Topography


Roman et al. (2009) index


St

2.54996070447

Rcv

0.589766409415

Rse

0.0

Rst

2.5313494051e-06

Rsv

0.586719777178


Height range @ 1km [m]

19

Height range @ 2km [m]

27

Height range @ 5km [m]

62

Height range @ 10km [m]

-999

Height range @ 20km [m]

-999


Variance slope @ 1 km

62

Variance slope @ 2 km

71

Variance slope @ 5 km

94

Variance slope @ 10 km

-999

Variance slope @ 20 km

-999


NDVI (max. NDVI composite)


Roman et al. (2009) index


St

3.23683732005e-08

Rcv

0.234206185568

Rse

0.0

Rst

0.118042864728

Rsv

92683063.4959


NDVI range @ 1km [-]

0.08

NDVI range @ 2km [-]

0.15

NDVI range @ 5km [-]

0.25

NDVI range @ 10km [-]

0.2

NDVI range @ 20km [-]

0.2


Variance slope @ 1 km

0.000574031245086

Variance slope @ 2 km

0.000628428852758

Variance slope @ 5 km

0.000550830149077

Variance slope @ 10 km

0.000290382872167

Variance slope @ 20 km

0.000122406657862


NDVI (min. NDVI composite)I


Roman et al. (2009) index


St

3.36457714407e-06

Rcv

0.123682269368

Rse

0.0

Rst

0.357787142864

Rsv

891642.025611


NDVI range @ 1km [-]

0.02

NDVI range @ 2km [-]

0.05

NDVI range @ 5km [-]

0.06

NDVI range @ 10km [-]

0.05

NDVI range @ 20km [-]

0.22


NDVI slope @ 1 km

0.000205114856919

NDVI slope @ 2 km

0.000221123281845

NDVI slope @ 5 km

0.000246741032056

NDVI slope @ 10 km

0.000200685940958

NDVI slope @ 20 km

0.000167403559656


Temporal stability analysis

+000 deg (BHR)


BHR statistics

Temporal stability [1/decade]:


abs

rel


Weighted least square:

None


Ordinary least square:

None


Probabilities that GCOS criteria is met:

Weighted least square:

None %

Ordinary least square:

None %


DHR statistics

Temporal stability [1/decade]:


abs

rel


Weighted least square:

None


Ordinary least square:

None


Probabilities that GCOS criteria is met:

Weighted least square:

None %

Ordinary least square:

None %


+057/+063 deg (BHR)


BHR statistics

Temporal stability [1/decade]:


abs

rel


Weighted least square:

None


Ordinary least square:

None


Probabilities that GCOS criteria is met:

Weighted least square:

None %

Ordinary least square:

None %


DHR statistics

Temporal stability [1/decade]:


abs

rel


Weighted least square:

None


Ordinary least square:

None


Probabilities that GCOS criteria is met:

Weighted least square:

None %

Ordinary least square:

None %


Temporal anomaly analyis

The variance of the temporal anomalies provides an additional measure about the stability of the signal AFTER removal of the mean seasonal cylce.

+000 deg


+057/+063 deg