NEON_HIGHPARKFIRE


Location

lon / lat [deg]: -105.3356 / 40.6242

Source network: AERONET


Geostationary surface albedo (GSA) data


“+000”


“+057/+063”


Landcover information (based on ESA CCI landcover data)


Landcover fractions @ 2km distance


Landcover fractions @ 20 km distance


Legend


Distance to open water bodies [km]:

7.95

Distance to urban areas [km]:

7.93


Radius: 1 km

Number of landcover classes:

1

Dominant landcover type:

70: Tree cover, needleleaved, evergreen, closed to open (>15%)

Fraction of dominant landcover type [%]:

100.0


Radius: 2 km

Number of landcover classes:

2

Dominant landcover type:

70: Tree cover, needleleaved, evergreen, closed to open (>15%)

Fraction of dominant landcover type [%]:

98.0


Radius: 5 km

Number of landcover classes:

2

Dominant landcover type:

70: Tree cover, needleleaved, evergreen, closed to open (>15%)

Fraction of dominant landcover type [%]:

97.0


Radius: 10 km

Number of landcover classes:

2

Dominant landcover type:

70: Tree cover, needleleaved, evergreen, closed to open (>15%)

Fraction of dominant landcover type [%]:

91.0


Radius: 20 km

Number of landcover classes:

3

Dominant landcover type:

70: Tree cover, needleleaved, evergreen, closed to open (>15%)

Fraction of dominant landcover type [%]:

63.0


Disturbances


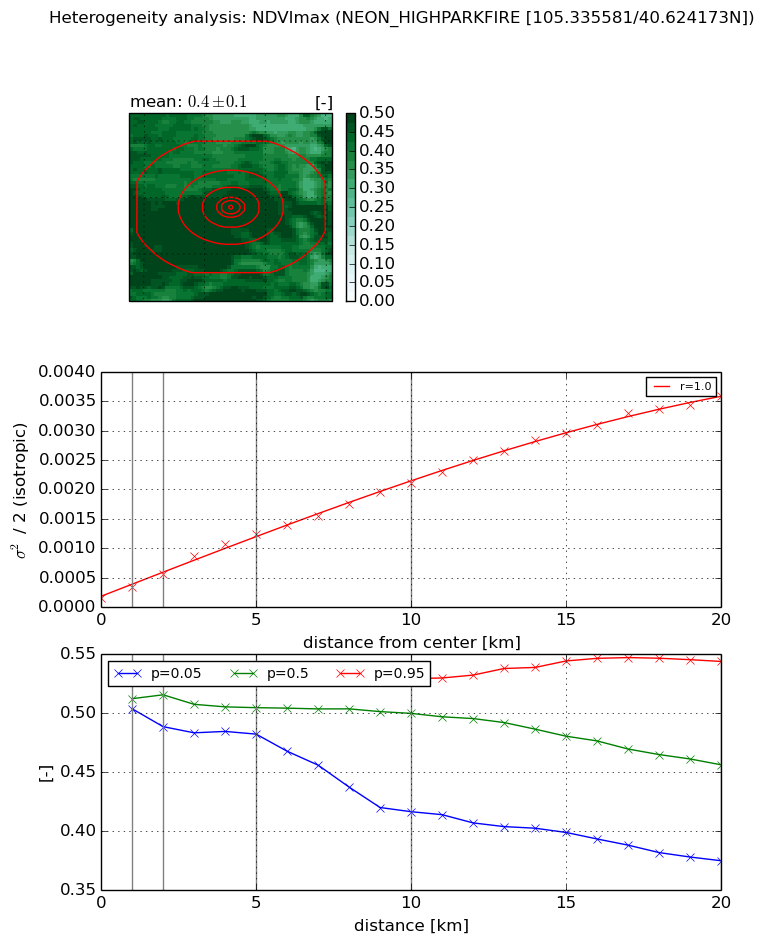
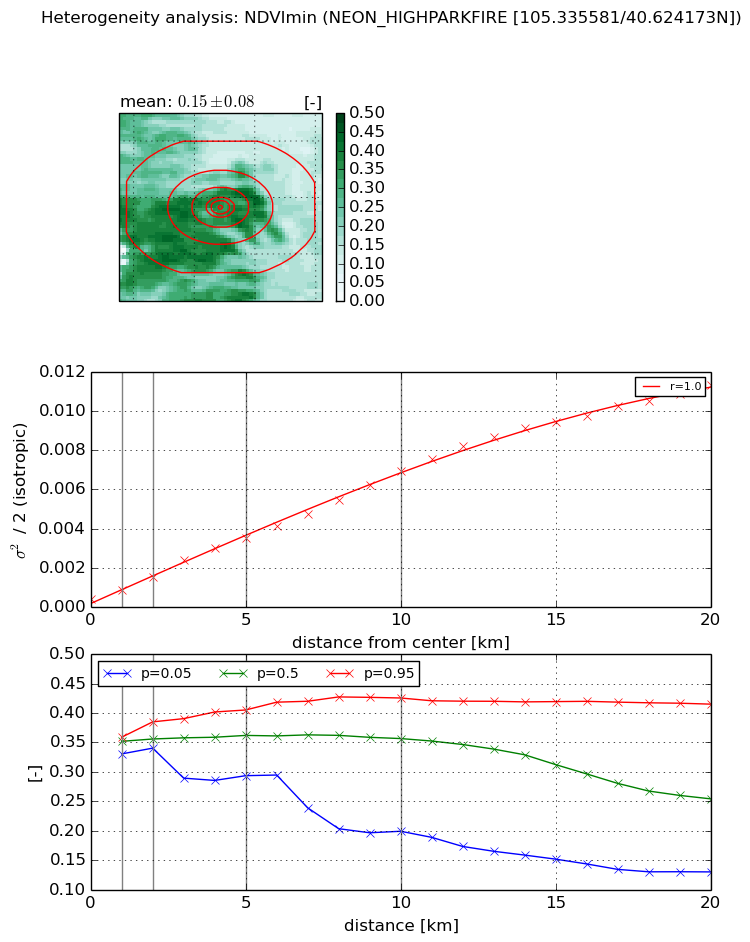
Heterogeneity analysis

The heterogeneity analysis provides information about the spatial and temporal heterogeneity of the site.

Topography


Roman et al. (2009) index


St

2.56626861496

Rcv

0.150375459423

Rse

0.0

Rst

-0.0935639609382

Rsv

0.925073044861


Height range @ 1km [m]

194

Height range @ 2km [m]

272

Height range @ 5km [m]

338

Height range @ 10km [m]

-999

Height range @ 20km [m]

-999


Variance slope @ 1 km

5648

Variance slope @ 2 km

5096

Variance slope @ 5 km

3265

Variance slope @ 10 km

-999

Variance slope @ 20 km

-999


NDVI (max. NDVI composite)


Roman et al. (2009) index


St

7.6776321437

Rcv

-0.0611416380413

Rse

0.0

Rst

-0.0968710181837

Rsv

0.232732816318


NDVI range @ 1km [-]

0.03

NDVI range @ 2km [-]

0.04

NDVI range @ 5km [-]

0.05

NDVI range @ 10km [-]

0.11

NDVI range @ 20km [-]

0.17


Variance slope @ 1 km

0.00018219138029

Variance slope @ 2 km

0.000204581626372

Variance slope @ 5 km

0.000226117947051

Variance slope @ 10 km

0.000194392510107

Variance slope @ 20 km

0.000172990935714


NDVI (min. NDVI composite)I


Roman et al. (2009) index


St

14.1773767702

Rcv

0.0936353143479

Rse

0.0

Rst

-0.0221934393581

Rsv

-0.0957759774524


NDVI range @ 1km [-]

0.03

NDVI range @ 2km [-]

0.04

NDVI range @ 5km [-]

0.11

NDVI range @ 10km [-]

0.23

NDVI range @ 20km [-]

0.29


NDVI slope @ 1 km

0.00049389379726

NDVI slope @ 2 km

0.000561148625343

NDVI slope @ 5 km

0.000654671470803

NDVI slope @ 10 km

0.000652275755073

NDVI slope @ 20 km

0.000564900096401


Temporal stability analysis

+000 deg (BHR)


BHR statistics

Temporal stability [1/decade]:


abs

rel


Weighted least square:

None


Ordinary least square:

None


Probabilities that GCOS criteria is met:

Weighted least square:

None %

Ordinary least square:

None %


DHR statistics

Temporal stability [1/decade]:


abs

rel


Weighted least square:

None


Ordinary least square:

None


Probabilities that GCOS criteria is met:

Weighted least square:

None %

Ordinary least square:

None %


+057/+063 deg (BHR)


BHR statistics

Temporal stability [1/decade]:


abs

rel


Weighted least square:

None


Ordinary least square:

None


Probabilities that GCOS criteria is met:

Weighted least square:

None %

Ordinary least square:

None %


DHR statistics

Temporal stability [1/decade]:


abs

rel


Weighted least square:

None


Ordinary least square:

None


Probabilities that GCOS criteria is met:

Weighted least square:

None %

Ordinary least square:

None %


Temporal anomaly analyis

The variance of the temporal anomalies provides an additional measure about the stability of the signal AFTER removal of the mean seasonal cylce.

+000 deg


+057/+063 deg