NEON_STERLING


Location

lon / lat [deg]: -103.0293 / 40.4619

Source network: AERONET


Geostationary surface albedo (GSA) data


“+000”


“+057/+063”


Landcover information (based on ESA CCI landcover data)


Landcover fractions @ 2km distance


Landcover fractions @ 20 km distance


Legend


Distance to open water bodies [km]:

21.7

Distance to urban areas [km]:

19.85


Radius: 1 km

Number of landcover classes:

2

Dominant landcover type:

130: grassland

Fraction of dominant landcover type [%]:

89.0


Radius: 2 km

Number of landcover classes:

2

Dominant landcover type:

130: grassland

Fraction of dominant landcover type [%]:

88.0


Radius: 5 km

Number of landcover classes:

3

Dominant landcover type:

130: grassland

Fraction of dominant landcover type [%]:

92.0


Radius: 10 km

Number of landcover classes:

2

Dominant landcover type:

130: grassland

Fraction of dominant landcover type [%]:

94.0


Radius: 20 km

Number of landcover classes:

2

Dominant landcover type:

130: grassland

Fraction of dominant landcover type [%]:

87.0


Disturbances


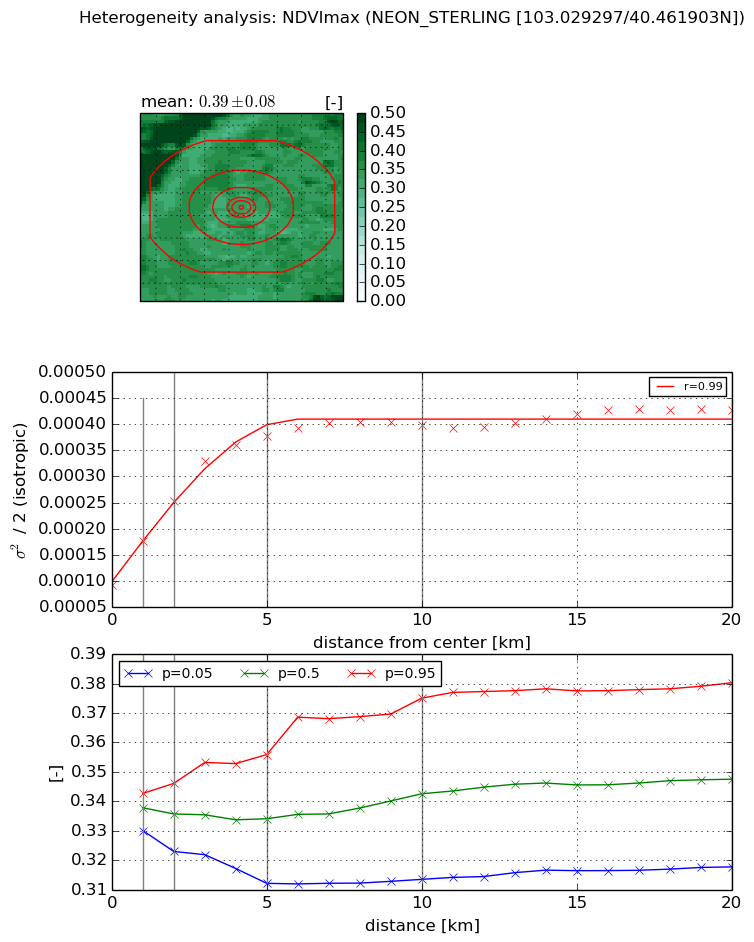
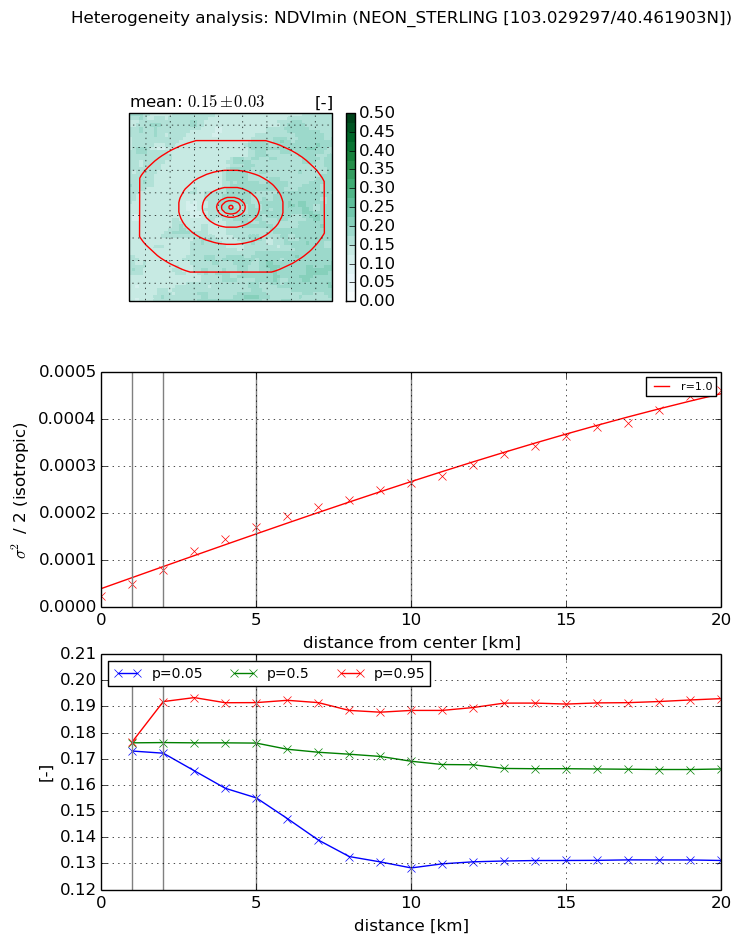
Heterogeneity analysis

The heterogeneity analysis provides information about the spatial and temporal heterogeneity of the site.

Topography


Roman et al. (2009) index


St

2.16566161054

Rcv

0.860969190891

Rse

0.0

Rst

-2.63820540509e-09

Rsv

0.524288773553


Height range @ 1km [m]

12

Height range @ 2km [m]

16

Height range @ 5km [m]

49

Height range @ 10km [m]

-999

Height range @ 20km [m]

-999


Variance slope @ 1 km

41

Variance slope @ 2 km

43

Variance slope @ 5 km

45

Variance slope @ 10 km

-999

Variance slope @ 20 km

-999


NDVI (max. NDVI composite)


Roman et al. (2009) index


St

2.14132828552

Rcv

0.533857717486

Rse

0.0

Rst

-0.240753720516

Rsv

0.626388128618


NDVI range @ 1km [-]

0.01

NDVI range @ 2km [-]

0.02

NDVI range @ 5km [-]

0.04

NDVI range @ 10km [-]

0.06

NDVI range @ 20km [-]

0.06


Variance slope @ 1 km

8.35434873089e-05

Variance slope @ 2 km

8.03053225198e-05

Variance slope @ 5 km

5.86582709368e-05

Variance slope @ 10 km

2.78099164435e-05

Variance slope @ 20 km

1.08219430119e-05


NDVI (min. NDVI composite)I


Roman et al. (2009) index


St

1.81383880453

Rcv

0.438071348645

Rse

0.0

Rst

-0.215881143054

Rsv

-0.999998230114


NDVI range @ 1km [-]

0.0

NDVI range @ 2km [-]

0.02

NDVI range @ 5km [-]

0.04

NDVI range @ 10km [-]

0.06

NDVI range @ 20km [-]

0.06


NDVI slope @ 1 km

2.66322560649e-05

NDVI slope @ 2 km

2.80230966339e-05

NDVI slope @ 5 km

3.03567931987e-05

NDVI slope @ 10 km

2.44361514828e-05

NDVI slope @ 20 km

2.09405364267e-05


Temporal stability analysis

+000 deg (BHR)


BHR statistics

Temporal stability [1/decade]:


abs

rel


Weighted least square:

None


Ordinary least square:

None


Probabilities that GCOS criteria is met:

Weighted least square:

None %

Ordinary least square:

None %


DHR statistics

Temporal stability [1/decade]:


abs

rel


Weighted least square:

None


Ordinary least square:

None


Probabilities that GCOS criteria is met:

Weighted least square:

None %

Ordinary least square:

None %


+057/+063 deg (BHR)


BHR statistics

Temporal stability [1/decade]:


abs

rel


Weighted least square:

None


Ordinary least square:

None


Probabilities that GCOS criteria is met:

Weighted least square:

None %

Ordinary least square:

None %


DHR statistics

Temporal stability [1/decade]:


abs

rel


Weighted least square:

None


Ordinary least square:

None


Probabilities that GCOS criteria is met:

Weighted least square:

None %

Ordinary least square:

None %


Temporal anomaly analyis

The variance of the temporal anomalies provides an additional measure about the stability of the signal AFTER removal of the mean seasonal cylce.

+000 deg


+057/+063 deg