NIABRARA


Location

lon / lat [deg]: -100.02 / 42.7648

Source network: AERONET


Geostationary surface albedo (GSA) data


“+000”


“+057/+063”


Landcover information (based on ESA CCI landcover data)


Landcover fractions @ 2km distance


Landcover fractions @ 20 km distance


Legend


Distance to open water bodies [km]:

7.4

Distance to urban areas [km]:

26.43


Radius: 1 km

Number of landcover classes:

1

Dominant landcover type:

130: grassland

Fraction of dominant landcover type [%]:

100.0


Radius: 2 km

Number of landcover classes:

1

Dominant landcover type:

130: grassland

Fraction of dominant landcover type [%]:

100.0


Radius: 5 km

Number of landcover classes:

2

Dominant landcover type:

130: grassland

Fraction of dominant landcover type [%]:

93.0


Radius: 10 km

Number of landcover classes:

2

Dominant landcover type:

130: grassland

Fraction of dominant landcover type [%]:

89.0


Radius: 20 km

Number of landcover classes:

3

Dominant landcover type:

130: grassland

Fraction of dominant landcover type [%]:

85.0


Disturbances


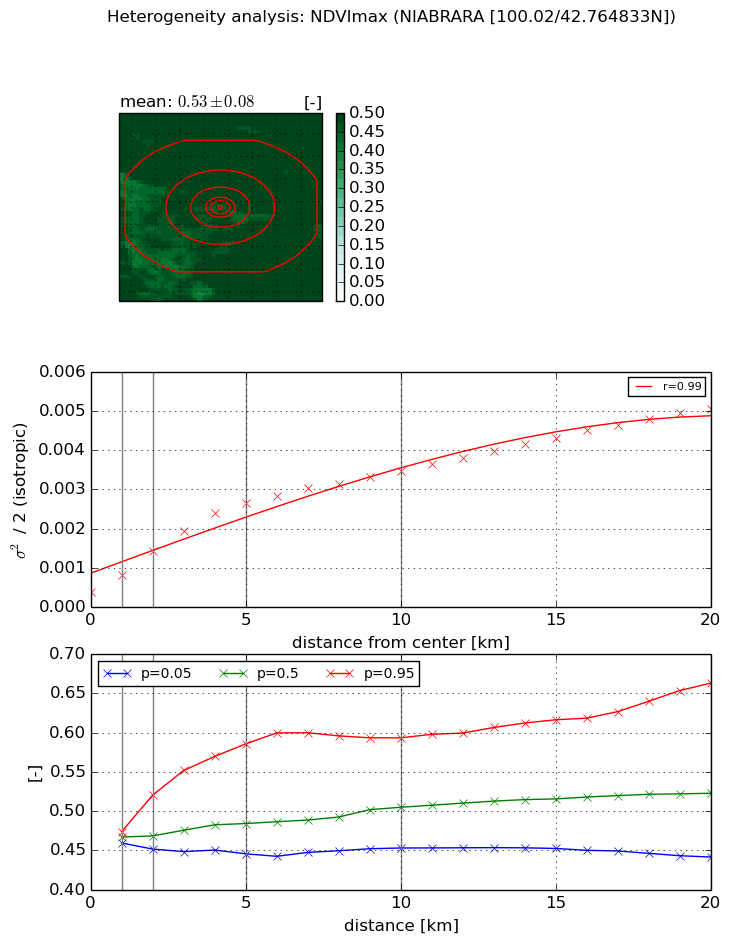
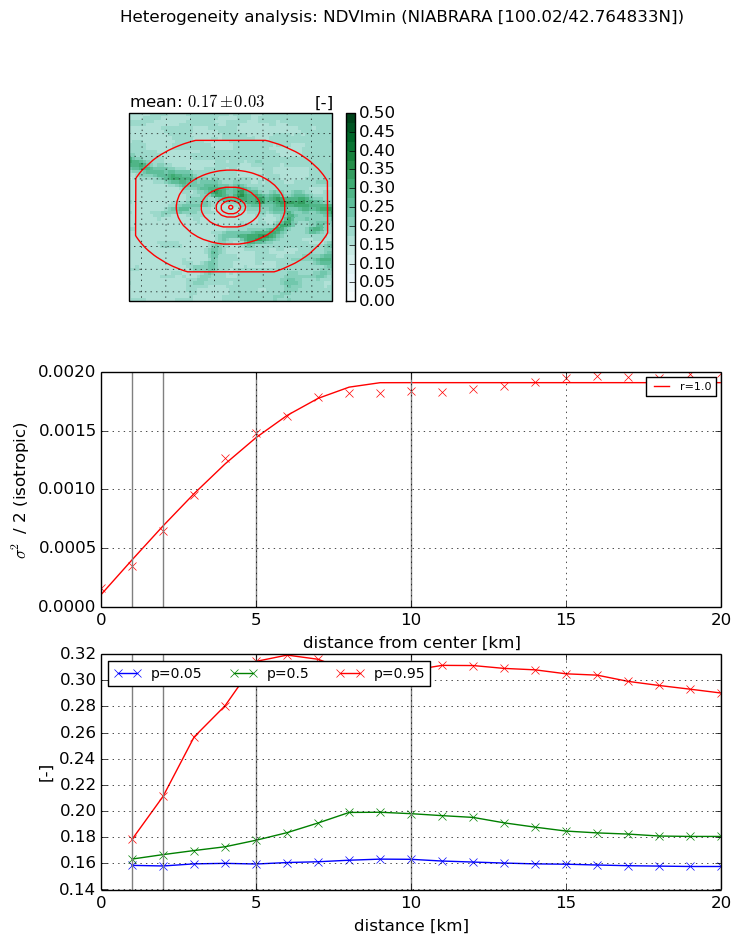
Heterogeneity analysis

The heterogeneity analysis provides information about the spatial and temporal heterogeneity of the site.

Topography


Roman et al. (2009) index


St

5.28204682753e-05

Rcv

0.182469248525

Rse

0.0

Rst

-0.0211273384278

Rsv

56795.9608063


Height range @ 1km [m]

19

Height range @ 2km [m]

45

Height range @ 5km [m]

110

Height range @ 10km [m]

-999

Height range @ 20km [m]

-999


Variance slope @ 1 km

336

Variance slope @ 2 km

359

Variance slope @ 5 km

233

Variance slope @ 10 km

-999

Variance slope @ 20 km

-999


NDVI (max. NDVI composite)


Roman et al. (2009) index


St

0.0724088676633

Rcv

0.374165012574

Rse

0.0

Rst

6.68224253307e-09

Rsv

41.0572244889


NDVI range @ 1km [-]

0.01

NDVI range @ 2km [-]

0.07

NDVI range @ 5km [-]

0.14

NDVI range @ 10km [-]

0.14

NDVI range @ 20km [-]

0.22


Variance slope @ 1 km

0.000423069259401

Variance slope @ 2 km

0.000511197629607

Variance slope @ 5 km

0.000474370620718

Variance slope @ 10 km

0.000301731020646

Variance slope @ 20 km

0.000208454509595


NDVI (min. NDVI composite)I


Roman et al. (2009) index


St

0.30351053322

Rcv

0.493814623907

Rse

0.0

Rst

2.30754311599e-08

Rsv

9.39052105686


NDVI range @ 1km [-]

0.02

NDVI range @ 2km [-]

0.05

NDVI range @ 5km [-]

0.16

NDVI range @ 10km [-]

0.14

NDVI range @ 20km [-]

0.13


NDVI slope @ 1 km

0.000188163383567

NDVI slope @ 2 km

0.000242221654532

NDVI slope @ 5 km

0.000275135472544

NDVI slope @ 10 km

0.000180010248872

NDVI slope @ 20 km

7.5904295261e-05


Temporal stability analysis

+000 deg (BHR)


BHR statistics

Temporal stability [1/decade]:


abs

rel


Weighted least square:

None


Ordinary least square:

None


Probabilities that GCOS criteria is met:

Weighted least square:

None %

Ordinary least square:

None %


DHR statistics

Temporal stability [1/decade]:


abs

rel


Weighted least square:

None


Ordinary least square:

None


Probabilities that GCOS criteria is met:

Weighted least square:

None %

Ordinary least square:

None %


+057/+063 deg (BHR)


BHR statistics

Temporal stability [1/decade]:


abs

rel


Weighted least square:

None


Ordinary least square:

None


Probabilities that GCOS criteria is met:

Weighted least square:

None %

Ordinary least square:

None %


DHR statistics

Temporal stability [1/decade]:


abs

rel


Weighted least square:

None


Ordinary least square:

None


Probabilities that GCOS criteria is met:

Weighted least square:

None %

Ordinary least square:

None %


Temporal anomaly analyis

The variance of the temporal anomalies provides an additional measure about the stability of the signal AFTER removal of the mean seasonal cylce.

+000 deg


+057/+063 deg