NL-HAA


Location

lon / lat [deg]: 4.8055 / 52.0031

Source network: FLUXNET


Geostationary surface albedo (GSA) data


“+000”


“+057/+063”


Landcover information (based on ESA CCI landcover data)


Landcover fractions @ 2km distance


Landcover fractions @ 20 km distance


Legend


Distance to open water bodies [km]:

3.24

Distance to urban areas [km]:

1.05


Radius: 1 km

Number of landcover classes:

1

Dominant landcover type:

130: grassland

Fraction of dominant landcover type [%]:

100.0


Radius: 2 km

Number of landcover classes:

2

Dominant landcover type:

130: grassland

Fraction of dominant landcover type [%]:

92.0


Radius: 5 km

Number of landcover classes:

4

Dominant landcover type:

130: grassland

Fraction of dominant landcover type [%]:

83.0


Radius: 10 km

Number of landcover classes:

5

Dominant landcover type:

130: grassland

Fraction of dominant landcover type [%]:

74.0


Radius: 20 km

Number of landcover classes:

6

Dominant landcover type:

130: grassland

Fraction of dominant landcover type [%]:

63.0


Disturbances


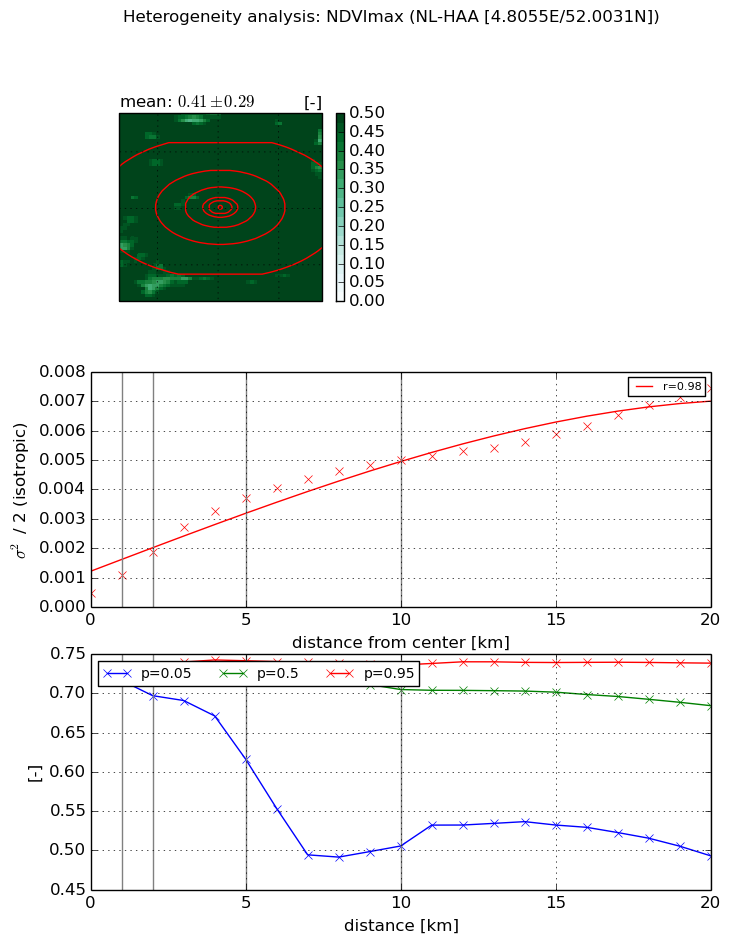
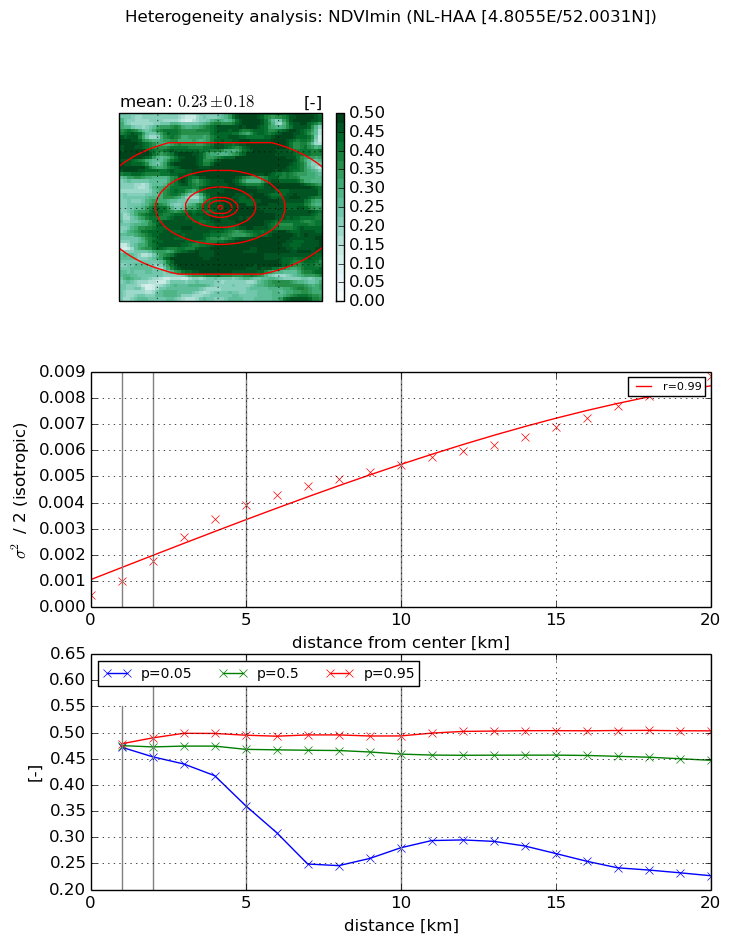
Heterogeneity analysis

The heterogeneity analysis provides information about the spatial and temporal heterogeneity of the site.

Topography


Roman et al. (2009) index


St

11.8513002059

Rcv

-0.0555700830935

Rse

0.0

Rst

0.191685800752

Rsv

-0.00588089843879


Height range @ 1km [m]

-99999

Height range @ 2km [m]

-99999

Height range @ 5km [m]

-99999

Height range @ 10km [m]

-99999

Height range @ 20km [m]

-99999


Variance slope @ 1 km

0

Variance slope @ 2 km

0

Variance slope @ 5 km

0

Variance slope @ 10 km

-999

Variance slope @ 20 km

-999


NDVI (max. NDVI composite)


Roman et al. (2009) index


St

1.00983998353

Rcv

2.04362426345

Rse

0.0

Rst

-0.116123130829

Rsv

0.811020300548


NDVI range @ 1km [-]

0.01

NDVI range @ 2km [-]

0.03

NDVI range @ 5km [-]

0.13

NDVI range @ 10km [-]

0.23

NDVI range @ 20km [-]

0.25


Variance slope @ 1 km

0.000587698584054

Variance slope @ 2 km

0.000695400170879

Variance slope @ 5 km

0.000670861294662

Variance slope @ 10 km

0.000453682342396

Variance slope @ 20 km

0.000298718601587


NDVI (min. NDVI composite)I


Roman et al. (2009) index


St

1.07564368502

Rcv

1.58065301128

Rse

0.0

Rst

0.181832308583

Rsv

1.0265423496


NDVI range @ 1km [-]

0.01

NDVI range @ 2km [-]

0.04

NDVI range @ 5km [-]

0.13

NDVI range @ 10km [-]

0.21

NDVI range @ 20km [-]

0.28


NDVI slope @ 1 km

0.000538653224152

NDVI slope @ 2 km

0.000665292022722

NDVI slope @ 5 km

0.000722138460809

NDVI slope @ 10 km

0.000509081705694

NDVI slope @ 20 km

0.000378668802434


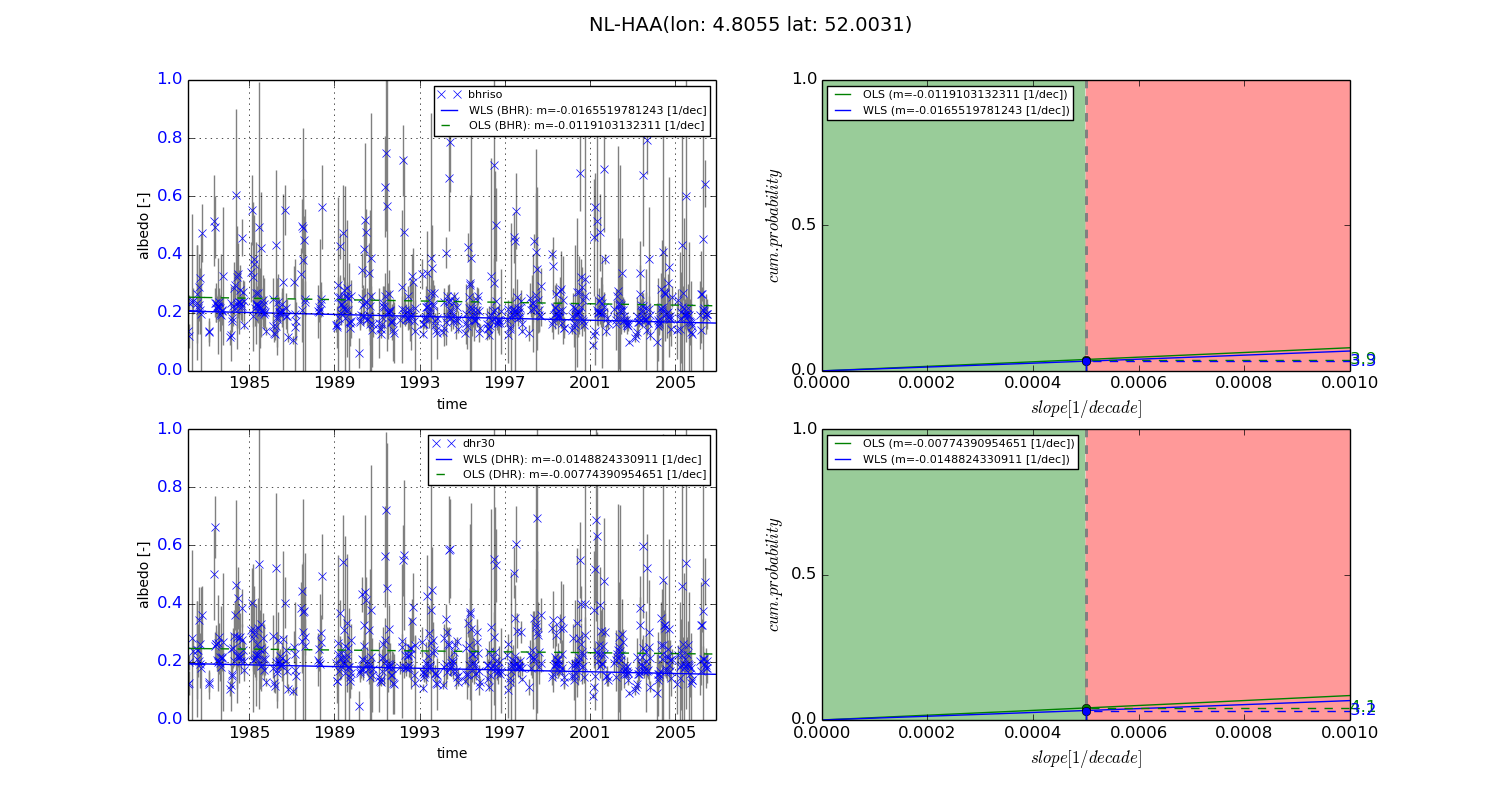
Temporal stability analysis

+000 deg (BHR)


BHR statistics

Temporal stability [1/decade]:


abs

rel


Weighted least square:

-0.0165519781243


Ordinary least square:

-0.0119103132311


Probabilities that GCOS criteria is met:

Weighted least square:

3.3 %

Ordinary least square:

3.9 %


DHR statistics

Temporal stability [1/decade]:


abs

rel


Weighted least square:

-0.0148824330911


Ordinary least square:

-0.00774390954651


Probabilities that GCOS criteria is met:

Weighted least square:

3.2 %

Ordinary least square:

4.1 %


+057/+063 deg (BHR)


BHR statistics

Temporal stability [1/decade]:


abs

rel


Weighted least square:

-99999.0


Ordinary least square:

-99999.0


Probabilities that GCOS criteria is met:

Weighted least square:

-99999.0 %

Ordinary least square:

-99999.0 %


DHR statistics

Temporal stability [1/decade]:


abs

rel


Weighted least square:

-99999.0


Ordinary least square:

-99999.0


Probabilities that GCOS criteria is met:

Weighted least square:

-99999.0 %

Ordinary least square:

-99999.0 %


Temporal anomaly analyis

The variance of the temporal anomalies provides an additional measure about the stability of the signal AFTER removal of the mean seasonal cylce.
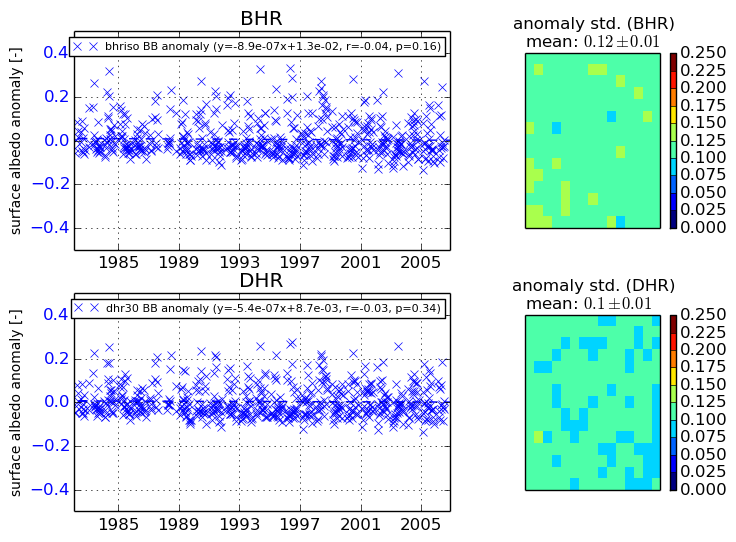
+000 deg


+057/+063 deg