NL-LAN


Location

lon / lat [deg]: 4.9029 / 51.9536

Source network: FLUXNET


Geostationary surface albedo (GSA) data


“+000”


“+057/+063”


Landcover information (based on ESA CCI landcover data)


Landcover fractions @ 2km distance


Landcover fractions @ 20 km distance


Legend


Distance to open water bodies [km]:

1.18

Distance to urban areas [km]:

1.31


Radius: 1 km

Number of landcover classes:

1

Dominant landcover type:

130: grassland

Fraction of dominant landcover type [%]:

100.0


Radius: 2 km

Number of landcover classes:

4

Dominant landcover type:

130: grassland

Fraction of dominant landcover type [%]:

81.0


Radius: 5 km

Number of landcover classes:

4

Dominant landcover type:

130: grassland

Fraction of dominant landcover type [%]:

79.0


Radius: 10 km

Number of landcover classes:

5

Dominant landcover type:

130: grassland

Fraction of dominant landcover type [%]:

85.0


Radius: 20 km

Number of landcover classes:

6

Dominant landcover type:

130: grassland

Fraction of dominant landcover type [%]:

65.0


Disturbances


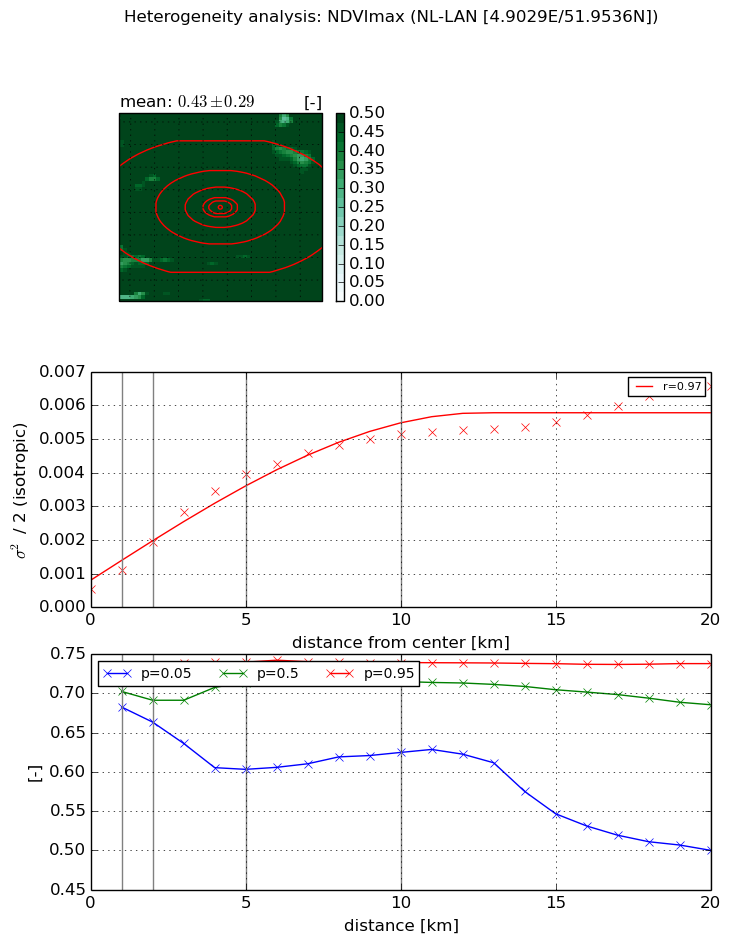
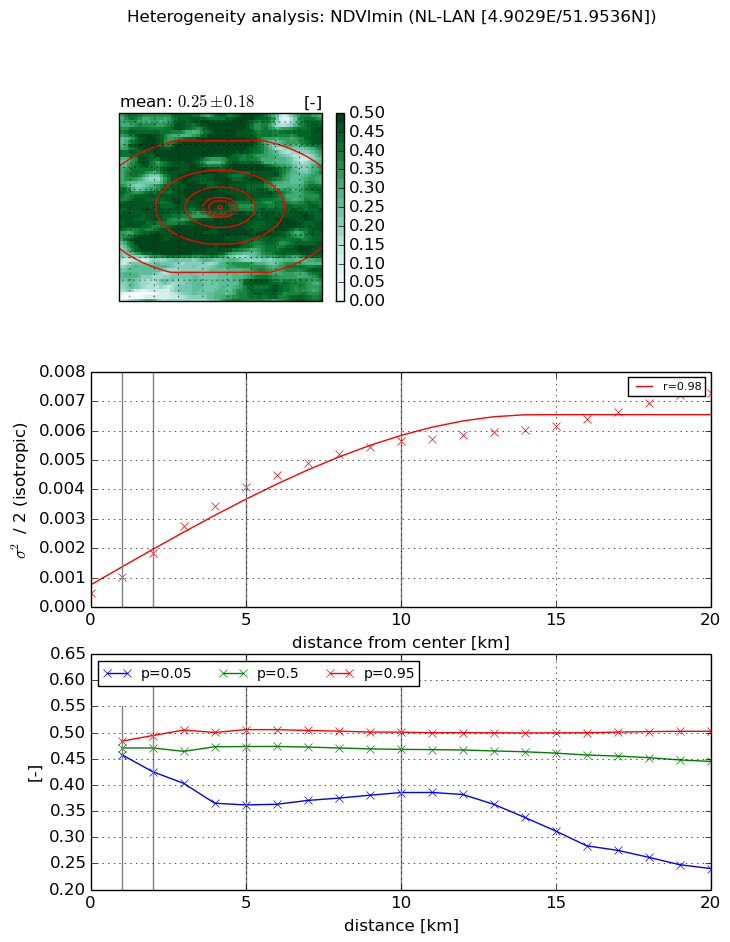
Heterogeneity analysis

The heterogeneity analysis provides information about the spatial and temporal heterogeneity of the site.

Topography


Roman et al. (2009) index


St

47.4662833613

Rcv

0.0321045806965

Rse

0.0

Rst

-0.00422351898555

Rsv

-0.0268746578872


Height range @ 1km [m]

2

Height range @ 2km [m]

4

Height range @ 5km [m]

4

Height range @ 10km [m]

-999

Height range @ 20km [m]

-999


Variance slope @ 1 km

1

Variance slope @ 2 km

0

Variance slope @ 5 km

0

Variance slope @ 10 km

-999

Variance slope @ 20 km

-999


NDVI (max. NDVI composite)


Roman et al. (2009) index


St

3.66781848276

Rcv

0.345617840794

Rse

0.0

Rst

0.117880474411

Rsv

-0.354426566875


NDVI range @ 1km [-]

0.03

NDVI range @ 2km [-]

0.06

NDVI range @ 5km [-]

0.14

NDVI range @ 10km [-]

0.11

NDVI range @ 20km [-]

0.24


Variance slope @ 1 km

0.000563268955936

Variance slope @ 2 km

0.000707188590858

Variance slope @ 5 km

0.000717673914156

Variance slope @ 10 km

0.000469143145097

Variance slope @ 20 km

0.000252525698803


NDVI (min. NDVI composite)I


Roman et al. (2009) index


St

4.12633937146

Rcv

0.272085898213

Rse

0.0

Rst

0.0959685639274

Rsv

-0.358982199155


NDVI range @ 1km [-]

0.03

NDVI range @ 2km [-]

0.07

NDVI range @ 5km [-]

0.14

NDVI range @ 10km [-]

0.12

NDVI range @ 20km [-]

0.26


NDVI slope @ 1 km

0.000515435604841

NDVI slope @ 2 km

0.000667816667958

NDVI slope @ 5 km

0.000748182103279

NDVI slope @ 10 km

0.000534690836162

NDVI slope @ 20 km

0.000299152101795


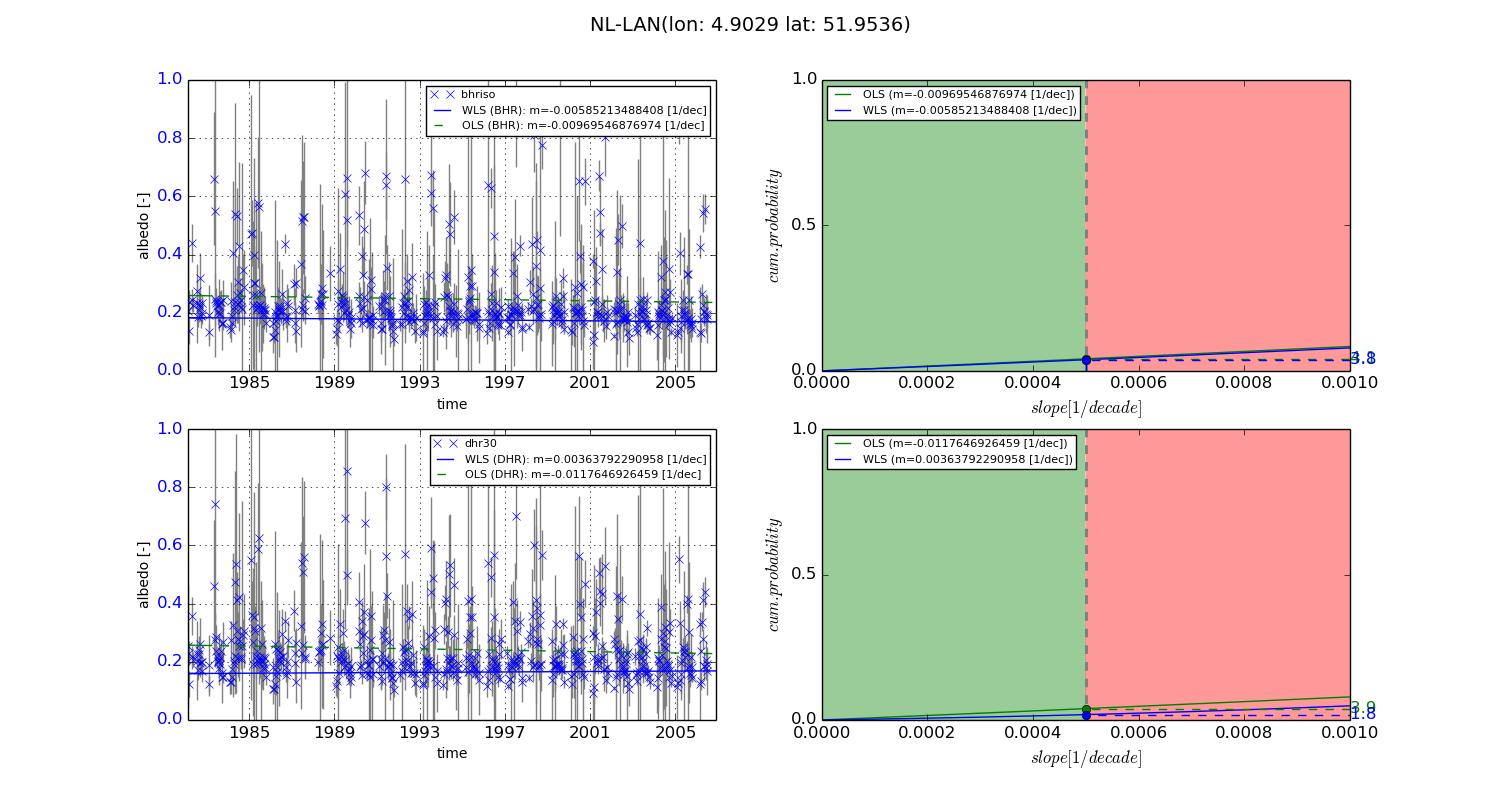
Temporal stability analysis

+000 deg (BHR)


BHR statistics

Temporal stability [1/decade]:


abs

rel


Weighted least square:

-0.00585213488408


Ordinary least square:

-0.00969546876974


Probabilities that GCOS criteria is met:

Weighted least square:

3.8 %

Ordinary least square:

4.1 %


DHR statistics

Temporal stability [1/decade]:


abs

rel


Weighted least square:

0.00363792290958


Ordinary least square:

-0.0117646926459


Probabilities that GCOS criteria is met:

Weighted least square:

1.8 %

Ordinary least square:

3.9 %


+057/+063 deg (BHR)


BHR statistics

Temporal stability [1/decade]:


abs

rel


Weighted least square:

-99999.0


Ordinary least square:

-99999.0


Probabilities that GCOS criteria is met:

Weighted least square:

-99999.0 %

Ordinary least square:

-99999.0 %


DHR statistics

Temporal stability [1/decade]:


abs

rel


Weighted least square:

-99999.0


Ordinary least square:

-99999.0


Probabilities that GCOS criteria is met:

Weighted least square:

-99999.0 %

Ordinary least square:

-99999.0 %


Temporal anomaly analyis

The variance of the temporal anomalies provides an additional measure about the stability of the signal AFTER removal of the mean seasonal cylce.
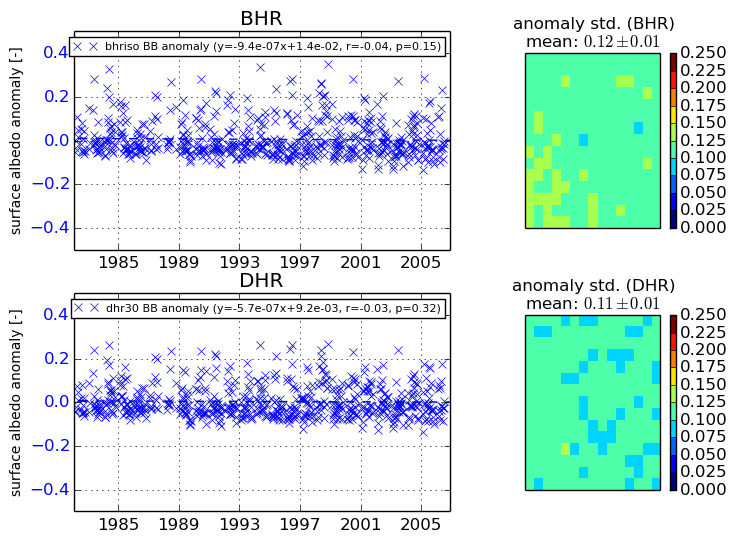
+000 deg


+057/+063 deg