NL-MOL


Location

lon / lat [deg]: 4.639 / 51.65

Source network: FLUXNET


Geostationary surface albedo (GSA) data


“+000”


“+057/+063”


Landcover information (based on ESA CCI landcover data)


Landcover fractions @ 2km distance


Landcover fractions @ 20 km distance


Legend


Distance to open water bodies [km]:

4.42

Distance to urban areas [km]:

0.51


Radius: 1 km

Number of landcover classes:

3

Dominant landcover type:

10: cropland, rainfed

Fraction of dominant landcover type [%]:

87.0


Radius: 2 km

Number of landcover classes:

3

Dominant landcover type:

10: cropland, rainfed

Fraction of dominant landcover type [%]:

69.0


Radius: 5 km

Number of landcover classes:

4

Dominant landcover type:

10: cropland, rainfed

Fraction of dominant landcover type [%]:

57.0


Radius: 10 km

Number of landcover classes:

4

Dominant landcover type:

10: cropland, rainfed

Fraction of dominant landcover type [%]:

45.0


Radius: 20 km

Number of landcover classes:

7

Dominant landcover type:

10: cropland, rainfed

Fraction of dominant landcover type [%]:

42.0


Disturbances


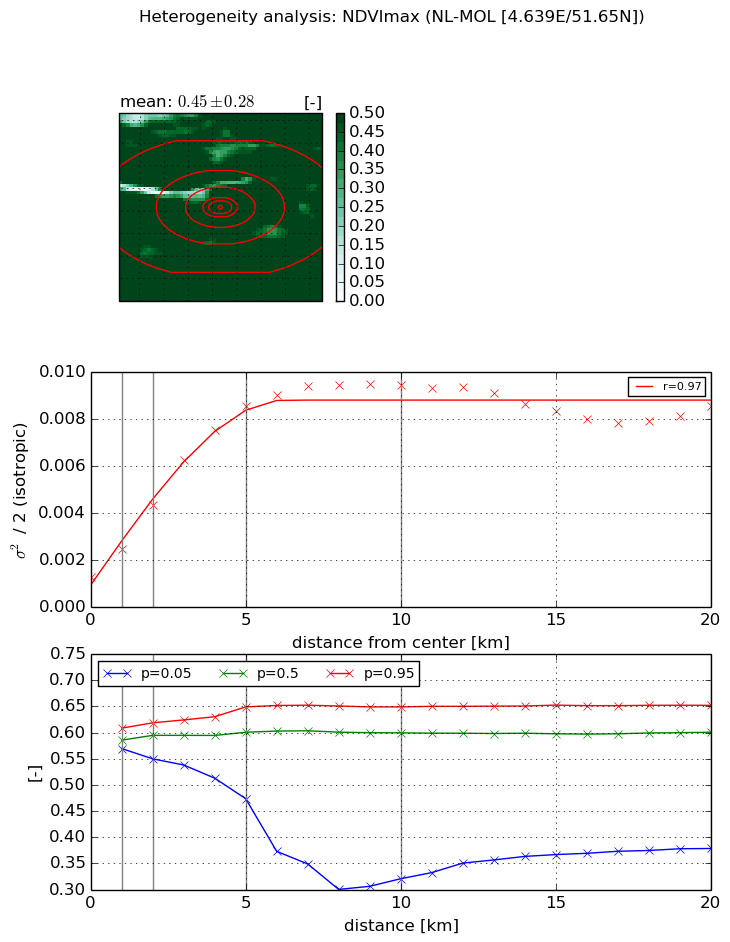
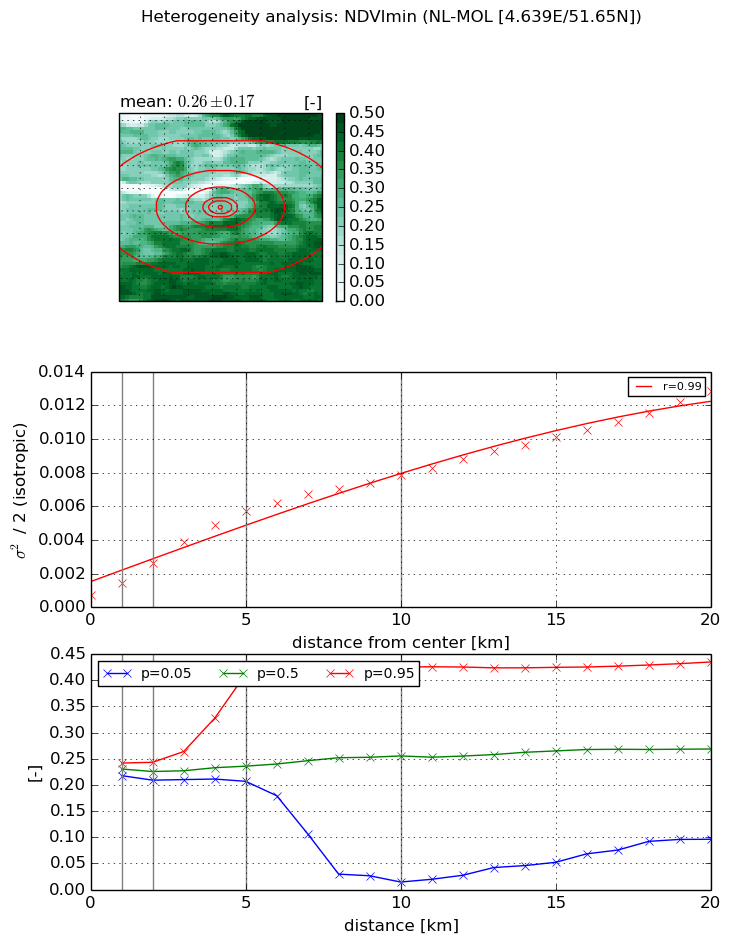
Heterogeneity analysis

The heterogeneity analysis provides information about the spatial and temporal heterogeneity of the site.

Topography


Roman et al. (2009) index


St

2.48869043851

Rcv

0.0541145051429

Rse

0.0

Rst

-0.701328517213

Rsv

0.450010236747


Height range @ 1km [m]

2

Height range @ 2km [m]

3

Height range @ 5km [m]

5

Height range @ 10km [m]

-999

Height range @ 20km [m]

-999


Variance slope @ 1 km

1

Variance slope @ 2 km

0

Variance slope @ 5 km

0

Variance slope @ 10 km

-999

Variance slope @ 20 km

-999


NDVI (max. NDVI composite)


Roman et al. (2009) index


St

1.17725321811

Rcv

1.34689554349

Rse

0.0

Rst

-0.201409630152

Rsv

-0.999999603836


NDVI range @ 1km [-]

0.04

NDVI range @ 2km [-]

0.07

NDVI range @ 5km [-]

0.18

NDVI range @ 10km [-]

0.33

NDVI range @ 20km [-]

0.27


Variance slope @ 1 km

0.00116522679847

Variance slope @ 2 km

0.0015224176372

Variance slope @ 5 km

0.00152730938232

Variance slope @ 10 km

0.000836068992307

Variance slope @ 20 km

0.000209765682548


NDVI (min. NDVI composite)I


Roman et al. (2009) index


St

0.849621689072

Rcv

2.34058974366

Rse

0.0

Rst

-0.190393774439

Rsv

-0.999999787281


NDVI range @ 1km [-]

0.02

NDVI range @ 2km [-]

0.03

NDVI range @ 5km [-]

0.2

NDVI range @ 10km [-]

0.41

NDVI range @ 20km [-]

0.34


NDVI slope @ 1 km

0.000723985838127

NDVI slope @ 2 km

0.000946696078969

NDVI slope @ 5 km

0.00104701185868

NDVI slope @ 10 km

0.000726087221042

NDVI slope @ 20 km

0.000548533549183


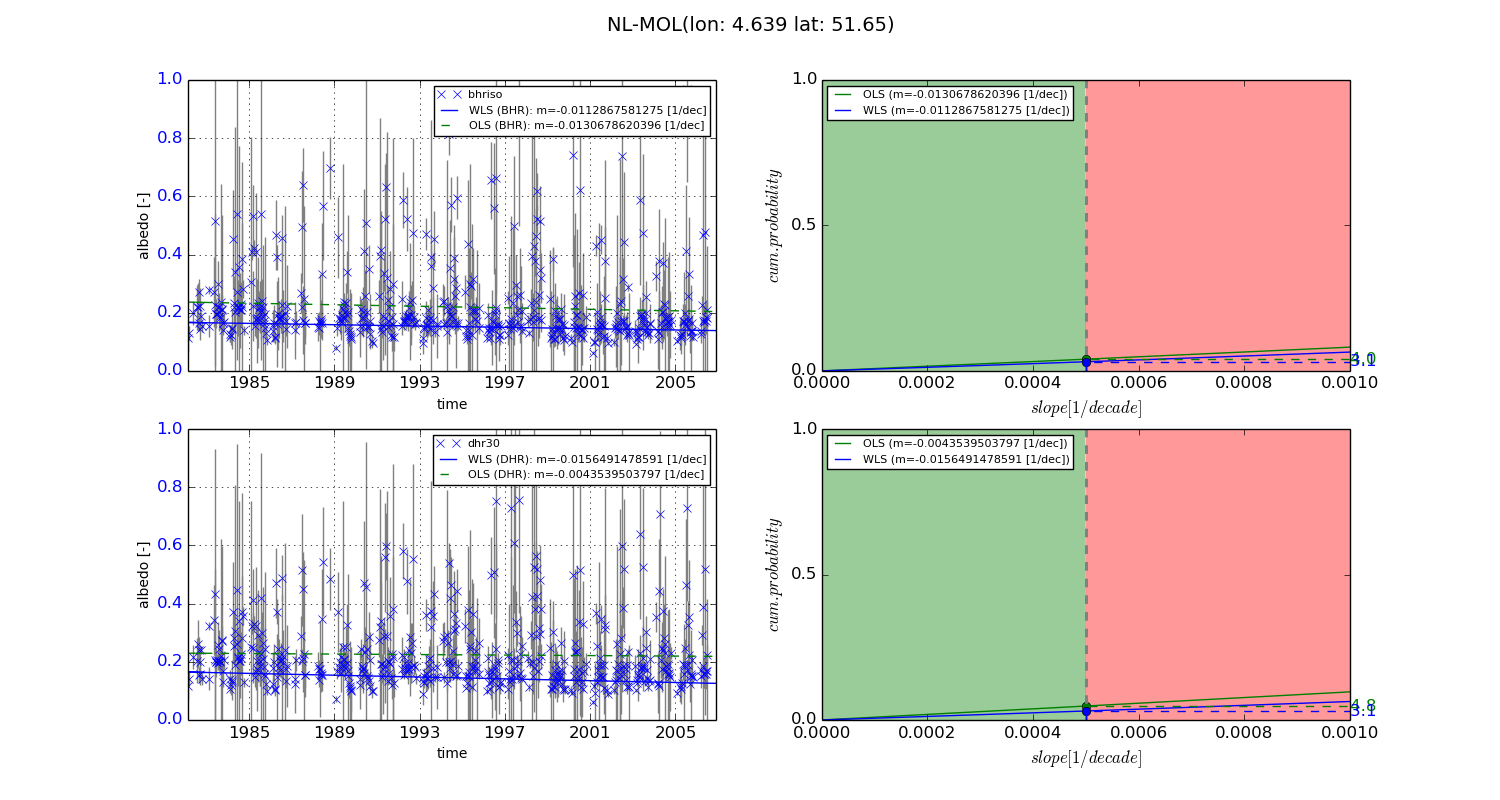
Temporal stability analysis

+000 deg (BHR)


BHR statistics

Temporal stability [1/decade]:


abs

rel


Weighted least square:

-0.0112867581275


Ordinary least square:

-0.0130678620396


Probabilities that GCOS criteria is met:

Weighted least square:

3.1 %

Ordinary least square:

4.0 %


DHR statistics

Temporal stability [1/decade]:


abs

rel


Weighted least square:

-0.0156491478591


Ordinary least square:

-0.0043539503797


Probabilities that GCOS criteria is met:

Weighted least square:

3.1 %

Ordinary least square:

4.8 %


+057/+063 deg (BHR)


BHR statistics

Temporal stability [1/decade]:


abs

rel


Weighted least square:

-99999.0


Ordinary least square:

-99999.0


Probabilities that GCOS criteria is met:

Weighted least square:

-99999.0 %

Ordinary least square:

-99999.0 %


DHR statistics

Temporal stability [1/decade]:


abs

rel


Weighted least square:

-99999.0


Ordinary least square:

-99999.0


Probabilities that GCOS criteria is met:

Weighted least square:

-99999.0 %

Ordinary least square:

-99999.0 %


Temporal anomaly analyis

The variance of the temporal anomalies provides an additional measure about the stability of the signal AFTER removal of the mean seasonal cylce.
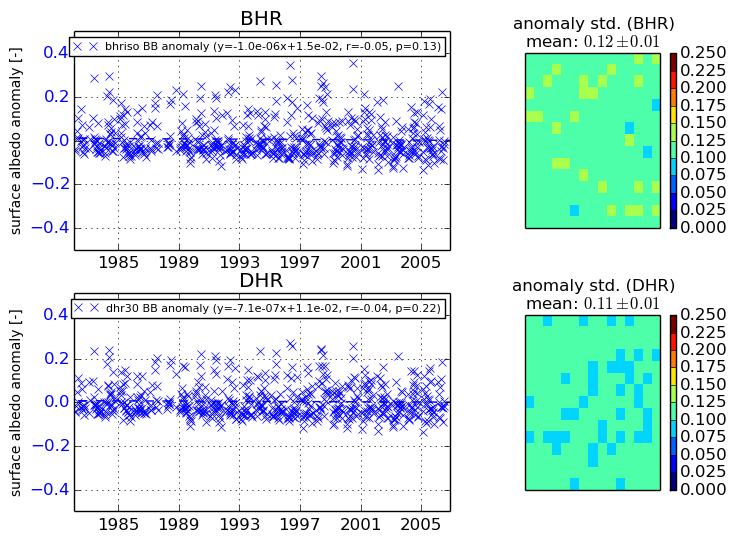
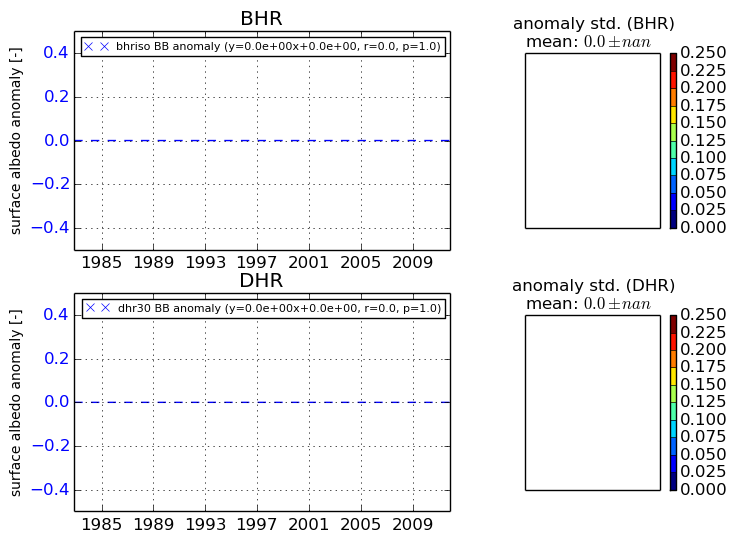
+000 deg


+057/+063 deg