NUIST


Location

lon / lat [deg]: 118.7172 / 32.2065

Source network: AERONET


Geostationary surface albedo (GSA) data


“+000”


“+057/+063”


Landcover information (based on ESA CCI landcover data)


Landcover fractions @ 2km distance


Landcover fractions @ 20 km distance


Legend


Distance to open water bodies [km]:

1.64

Distance to urban areas [km]:

0.1


Radius: 1 km

Number of landcover classes:

6

Dominant landcover type:

190: urban areas

Fraction of dominant landcover type [%]:

46.0


Radius: 2 km

Number of landcover classes:

8

Dominant landcover type:

10: cropland, rainfed

Fraction of dominant landcover type [%]:

39.0


Radius: 5 km

Number of landcover classes:

8

Dominant landcover type:

10: cropland, rainfed

Fraction of dominant landcover type [%]:

41.0


Radius: 10 km

Number of landcover classes:

10

Dominant landcover type:

10: cropland, rainfed

Fraction of dominant landcover type [%]:

41.0


Radius: 20 km

Number of landcover classes:

10

Dominant landcover type:

10: cropland, rainfed

Fraction of dominant landcover type [%]:

29.0


Disturbances


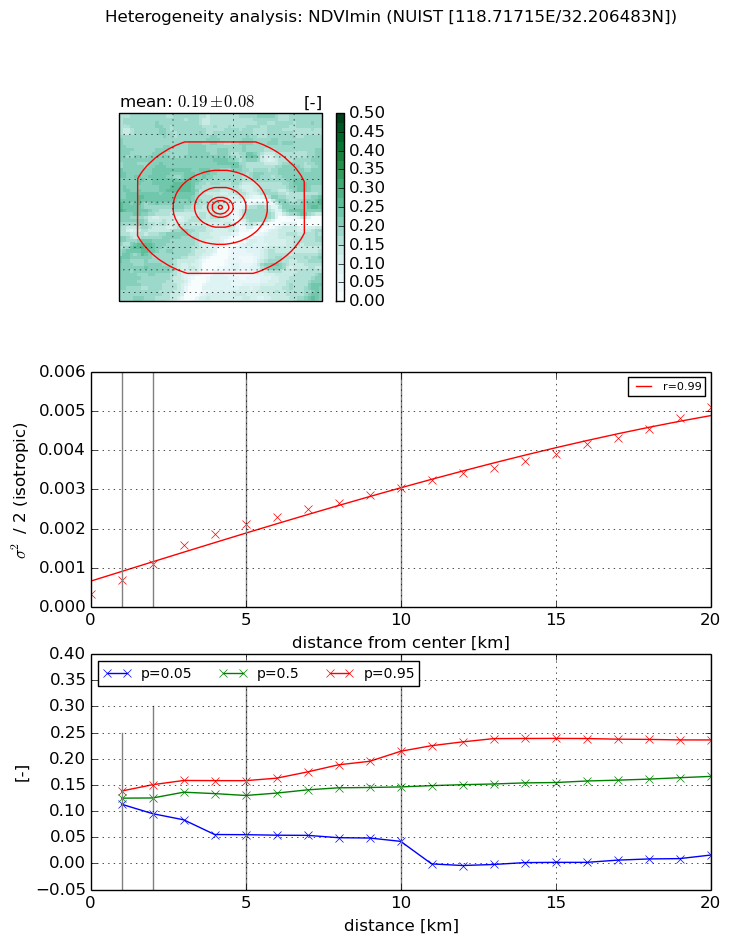
Heterogeneity analysis

The heterogeneity analysis provides information about the spatial and temporal heterogeneity of the site.

Topography


Roman et al. (2009) index


St

4.74370882121

Rcv

0.259931792294

Rse

0.0

Rst

0.162024160493

Rsv

0.210460604188


Height range @ 1km [m]

21

Height range @ 2km [m]

36

Height range @ 5km [m]

33

Height range @ 10km [m]

-999

Height range @ 20km [m]

-999


Variance slope @ 1 km

52

Variance slope @ 2 km

49

Variance slope @ 5 km

38

Variance slope @ 10 km

-999

Variance slope @ 20 km

-999


NDVI (max. NDVI composite)


Roman et al. (2009) index


St

4.6394916545e-06

Rcv

0.361359237361

Rse

0.0

Rst

0.233052041239

Rsv

646621.971897


NDVI range @ 1km [-]

0.07

NDVI range @ 2km [-]

0.15

NDVI range @ 5km [-]

0.35

NDVI range @ 10km [-]

0.4

NDVI range @ 20km [-]

0.45


Variance slope @ 1 km

0.00127326651624

Variance slope @ 2 km

0.00138156259207

Variance slope @ 5 km

0.00140356805918

Variance slope @ 10 km

0.00119783637737

Variance slope @ 20 km

0.00113851231496


NDVI (min. NDVI composite)I


Roman et al. (2009) index


St

1.76158729461

Rcv

0.25147200083

Rse

0.0

Rst

0.155144473474

Rsv

1.29639308371


NDVI range @ 1km [-]

0.03

NDVI range @ 2km [-]

0.06

NDVI range @ 5km [-]

0.1

NDVI range @ 10km [-]

0.17

NDVI range @ 20km [-]

0.22


NDVI slope @ 1 km

0.000353313397892

NDVI slope @ 2 km

0.000390833576806

NDVI slope @ 5 km

0.000371035454376

NDVI slope @ 10 km

0.000264416053289

NDVI slope @ 20 km

0.00021412902674


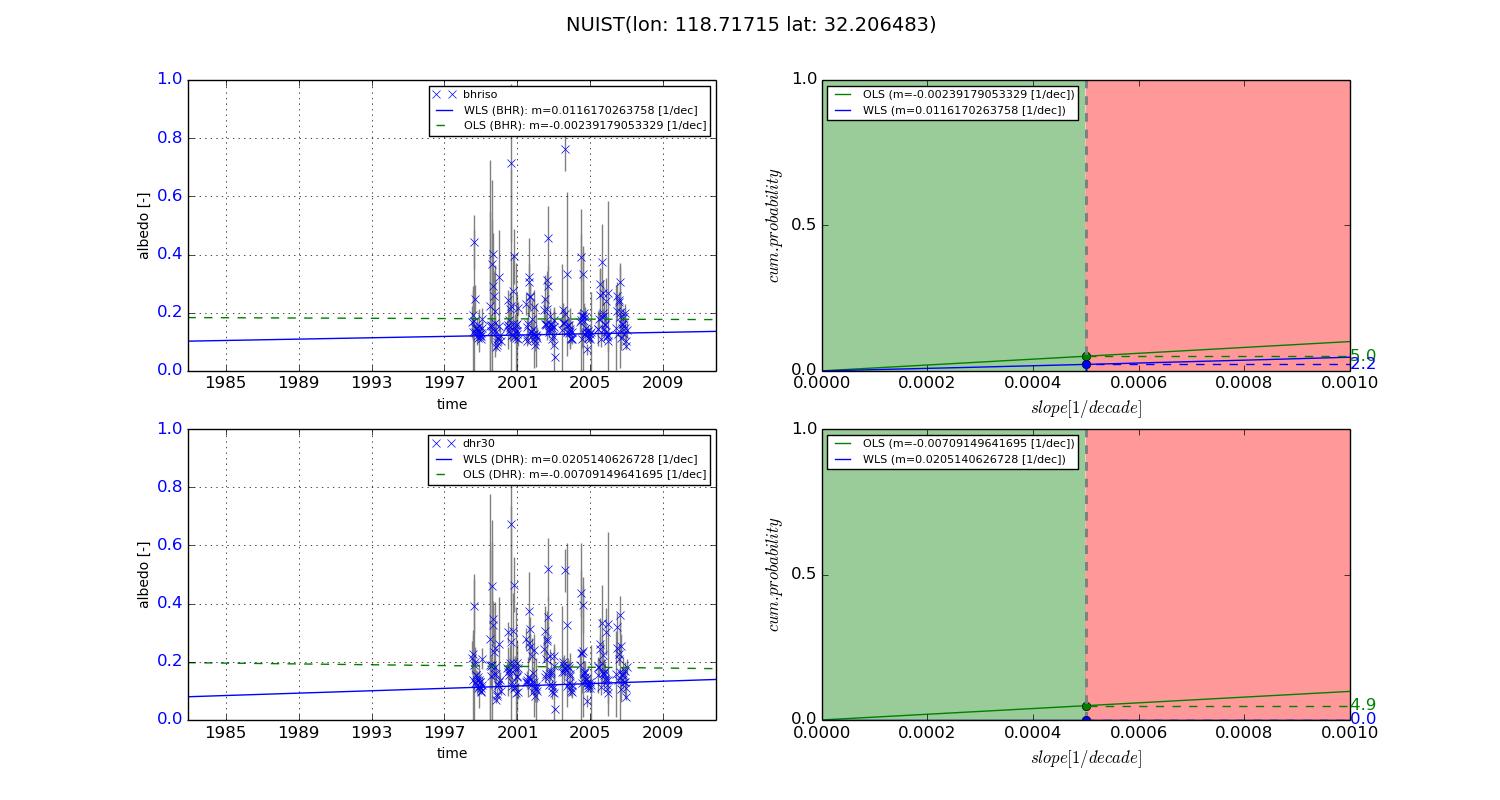
Temporal stability analysis

+000 deg (BHR)


BHR statistics

Temporal stability [1/decade]:


abs

rel


Weighted least square:

None


Ordinary least square:

None


Probabilities that GCOS criteria is met:

Weighted least square:

None %

Ordinary least square:

None %


DHR statistics

Temporal stability [1/decade]:


abs

rel


Weighted least square:

None


Ordinary least square:

None


Probabilities that GCOS criteria is met:

Weighted least square:

None %

Ordinary least square:

None %


+057/+063 deg (BHR)


BHR statistics

Temporal stability [1/decade]:


abs

rel


Weighted least square:

0.0116170263758


Ordinary least square:

-0.00239179053329


Probabilities that GCOS criteria is met:

Weighted least square:

2.2 %

Ordinary least square:

5.0 %


DHR statistics

Temporal stability [1/decade]:


abs

rel


Weighted least square:

0.0205140626728


Ordinary least square:

-0.00709149641695


Probabilities that GCOS criteria is met:

Weighted least square:

0.0 %

Ordinary least square:

4.9 %


Temporal anomaly analyis

The variance of the temporal anomalies provides an additional measure about the stability of the signal AFTER removal of the mean seasonal cylce.

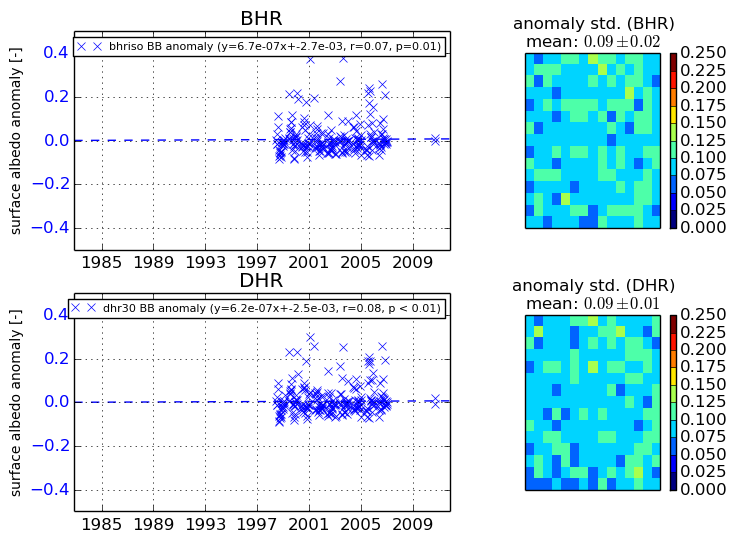
+000 deg


+057/+063 deg