NW_CHAPEL_HILL


Location

lon / lat [deg]: -79.0934 / 35.9712

Source network: AERONET


Geostationary surface albedo (GSA) data


“+000”


“+057/+063”


Landcover information (based on ESA CCI landcover data)


Landcover fractions @ 2km distance


Landcover fractions @ 20 km distance


Legend


Distance to open water bodies [km]:

2.49

Distance to urban areas [km]:

2.13


Radius: 1 km

Number of landcover classes:

6

Dominant landcover type:

60: Tree cover, broadleaved, decidous

Fraction of dominant landcover type [%]:

38.0


Radius: 2 km

Number of landcover classes:

6

Dominant landcover type:

130: grassland

Fraction of dominant landcover type [%]:

42.0


Radius: 5 km

Number of landcover classes:

7

Dominant landcover type:

130: grassland

Fraction of dominant landcover type [%]:

56.0


Radius: 10 km

Number of landcover classes:

5

Dominant landcover type:

130: grassland

Fraction of dominant landcover type [%]:

51.0


Radius: 20 km

Number of landcover classes:

6

Dominant landcover type:

130: grassland

Fraction of dominant landcover type [%]:

54.0


Disturbances


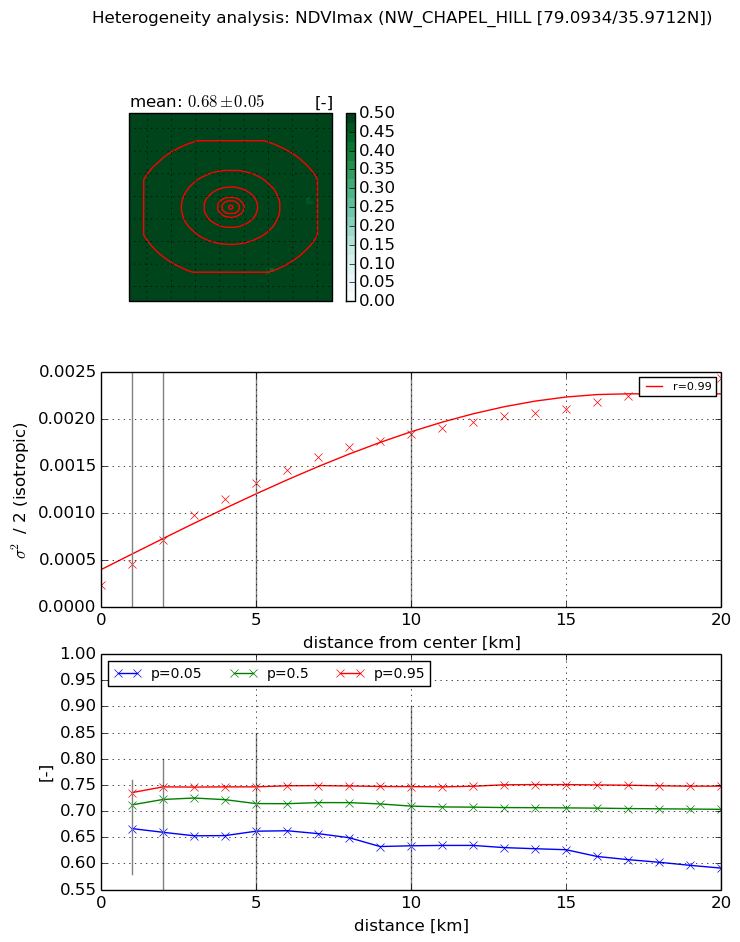
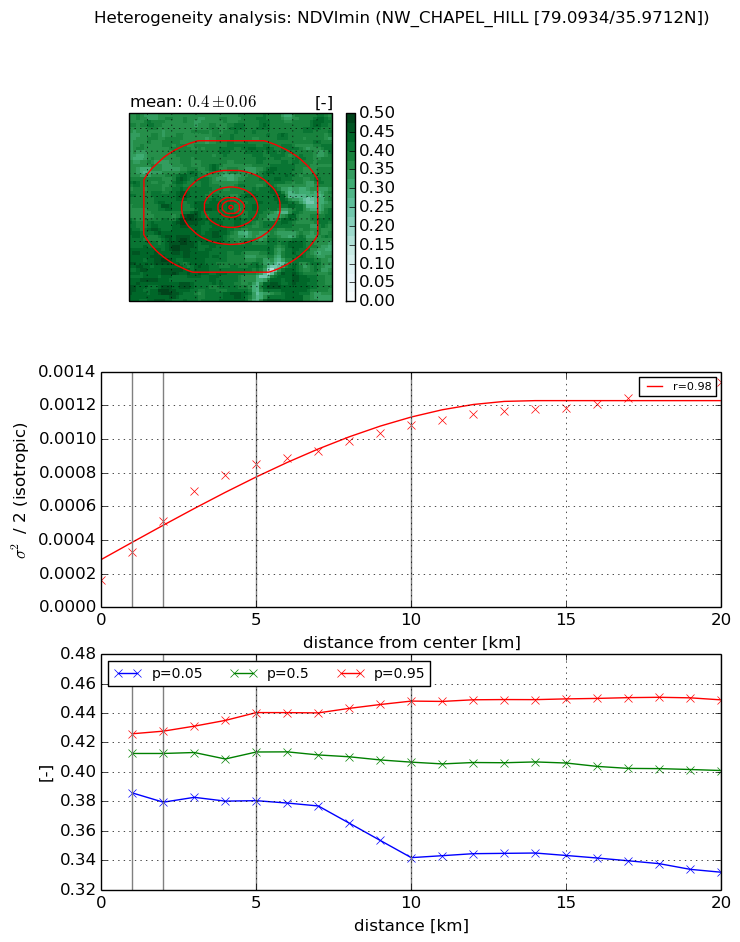
Heterogeneity analysis

The heterogeneity analysis provides information about the spatial and temporal heterogeneity of the site.

Topography


Roman et al. (2009) index


St

5.27779291058

Rcv

0.0637175646771

Rse

0.0

Rst

-0.103442838179

Rsv

0.401259019965


Height range @ 1km [m]

21

Height range @ 2km [m]

40

Height range @ 5km [m]

43

Height range @ 10km [m]

-999

Height range @ 20km [m]

-999


Variance slope @ 1 km

119

Variance slope @ 2 km

87

Variance slope @ 5 km

39

Variance slope @ 10 km

-999

Variance slope @ 20 km

-999


NDVI (max. NDVI composite)


Roman et al. (2009) index


St

8.7117095076

Rcv

-0.0628173335876

Rse

0.0

Rst

-0.0956255367607

Rsv

0.185921229187


NDVI range @ 1km [-]

0.07

NDVI range @ 2km [-]

0.09

NDVI range @ 5km [-]

0.08

NDVI range @ 10km [-]

0.11

NDVI range @ 20km [-]

0.16


Variance slope @ 1 km

0.000232344927402

Variance slope @ 2 km

0.000242312737262

Variance slope @ 5 km

0.000221449269651

Variance slope @ 10 km

0.000161218964464

Variance slope @ 20 km

9.79501754278e-05


NDVI (min. NDVI composite)I


Roman et al. (2009) index


St

2.38222883392

Rcv

0.11787065924

Rse

0.0

Rst

-0.263927759818

Rsv

0.877526443982


NDVI range @ 1km [-]

0.04

NDVI range @ 2km [-]

0.05

NDVI range @ 5km [-]

0.06

NDVI range @ 10km [-]

0.11

NDVI range @ 20km [-]

0.12


NDVI slope @ 1 km

0.000169201570125

NDVI slope @ 2 km

0.000175034744728

NDVI slope @ 5 km

0.000142922286443

NDVI slope @ 10 km

8.57055180741e-05

NDVI slope @ 20 km

4.81251200062e-05


Temporal stability analysis

+000 deg (BHR)


BHR statistics

Temporal stability [1/decade]:


abs

rel


Weighted least square:

-99999.0


Ordinary least square:

-99999.0


Probabilities that GCOS criteria is met:

Weighted least square:

-99999.0 %

Ordinary least square:

-99999.0 %


DHR statistics

Temporal stability [1/decade]:


abs

rel


Weighted least square:

-99999.0


Ordinary least square:

-99999.0


Probabilities that GCOS criteria is met:

Weighted least square:

-99999.0 %

Ordinary least square:

-99999.0 %


+057/+063 deg (BHR)


BHR statistics

Temporal stability [1/decade]:


abs

rel


Weighted least square:

None


Ordinary least square:

None


Probabilities that GCOS criteria is met:

Weighted least square:

None %

Ordinary least square:

None %


DHR statistics

Temporal stability [1/decade]:


abs

rel


Weighted least square:

None


Ordinary least square:

None


Probabilities that GCOS criteria is met:

Weighted least square:

None %

Ordinary least square:

None %


Temporal anomaly analyis

The variance of the temporal anomalies provides an additional measure about the stability of the signal AFTER removal of the mean seasonal cylce.

+000 deg


+057/+063 deg