OBERNAI


Location

lon / lat [deg]: 7.5425 / 48.4428

Source network: AERONET


Geostationary surface albedo (GSA) data


“+000”


“+057/+063”


Landcover information (based on ESA CCI landcover data)


Landcover fractions @ 2km distance


Landcover fractions @ 20 km distance


Legend


Distance to open water bodies [km]:

1.52

Distance to urban areas [km]:

0.34


Radius: 1 km

Number of landcover classes:

4

Dominant landcover type:

10: cropland, rainfed

Fraction of dominant landcover type [%]:

52.0


Radius: 2 km

Number of landcover classes:

6

Dominant landcover type:

10: cropland, rainfed

Fraction of dominant landcover type [%]:

72.0


Radius: 5 km

Number of landcover classes:

5

Dominant landcover type:

10: cropland, rainfed

Fraction of dominant landcover type [%]:

66.0


Radius: 10 km

Number of landcover classes:

5

Dominant landcover type:

10: cropland, rainfed

Fraction of dominant landcover type [%]:

58.0


Radius: 20 km

Number of landcover classes:

7

Dominant landcover type:

10: cropland, rainfed

Fraction of dominant landcover type [%]:

43.0


Disturbances


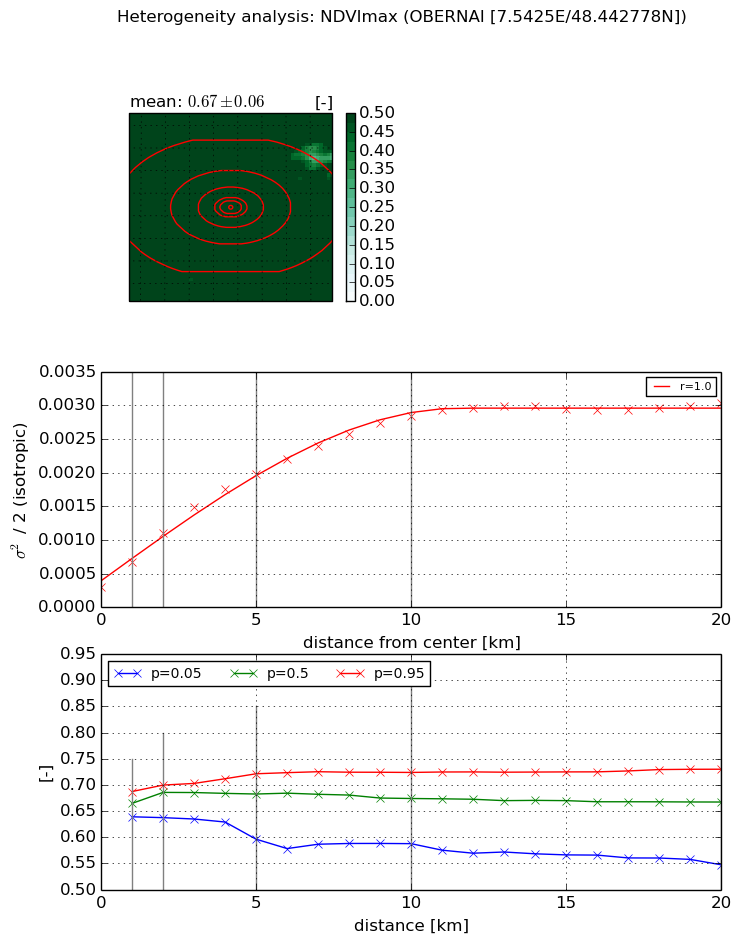
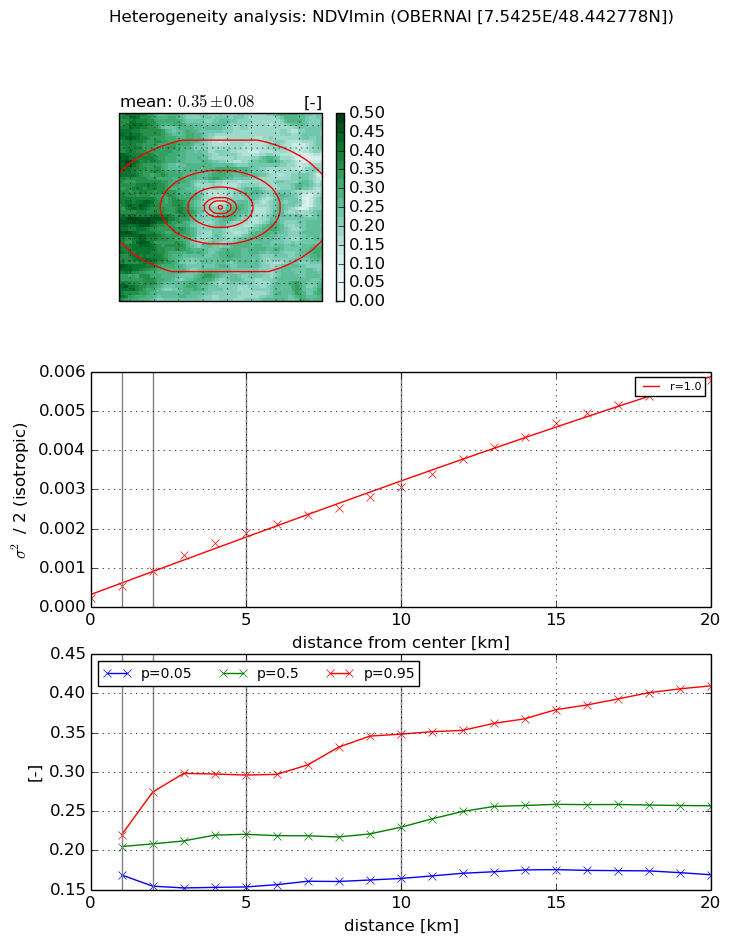
Heterogeneity analysis

The heterogeneity analysis provides information about the spatial and temporal heterogeneity of the site.

Topography


Roman et al. (2009) index


St

2.99675752384

Rcv

0.918520905389

Rse

0.0

Rst

-4.76691616045e-09

Rsv

-0.0825610846791


Height range @ 1km [m]

8

Height range @ 2km [m]

10

Height range @ 5km [m]

28

Height range @ 10km [m]

-999

Height range @ 20km [m]

-999


Variance slope @ 1 km

40

Variance slope @ 2 km

35

Variance slope @ 5 km

33

Variance slope @ 10 km

-999

Variance slope @ 20 km

-999


NDVI (max. NDVI composite)


Roman et al. (2009) index


St

1.37345479555e-07

Rcv

0.726990889279

Rse

0.0

Rst

0.145985417408

Rsv

21842727.4769


NDVI range @ 1km [-]

0.05

NDVI range @ 2km [-]

0.06

NDVI range @ 5km [-]

0.13

NDVI range @ 10km [-]

0.14

NDVI range @ 20km [-]

0.18


Variance slope @ 1 km

0.000370547909174

Variance slope @ 2 km

0.000403407672447

Variance slope @ 5 km

0.000345479318934

Variance slope @ 10 km

0.000251566391834

Variance slope @ 20 km

0.000118077081472


NDVI (min. NDVI composite)I


Roman et al. (2009) index


St

9.63499930351

Rcv

-0.0818207865472

Rse

0.0

Rst

-0.0305652620102

Rsv

-0.198978789726


NDVI range @ 1km [-]

0.05

NDVI range @ 2km [-]

0.12

NDVI range @ 5km [-]

0.14

NDVI range @ 10km [-]

0.18

NDVI range @ 20km [-]

0.24


NDVI slope @ 1 km

0.000303419159059

NDVI slope @ 2 km

0.000347510808495

NDVI slope @ 5 km

0.000343044569447

NDVI slope @ 10 km

0.000277963015007

NDVI slope @ 20 km

0.000279090480133


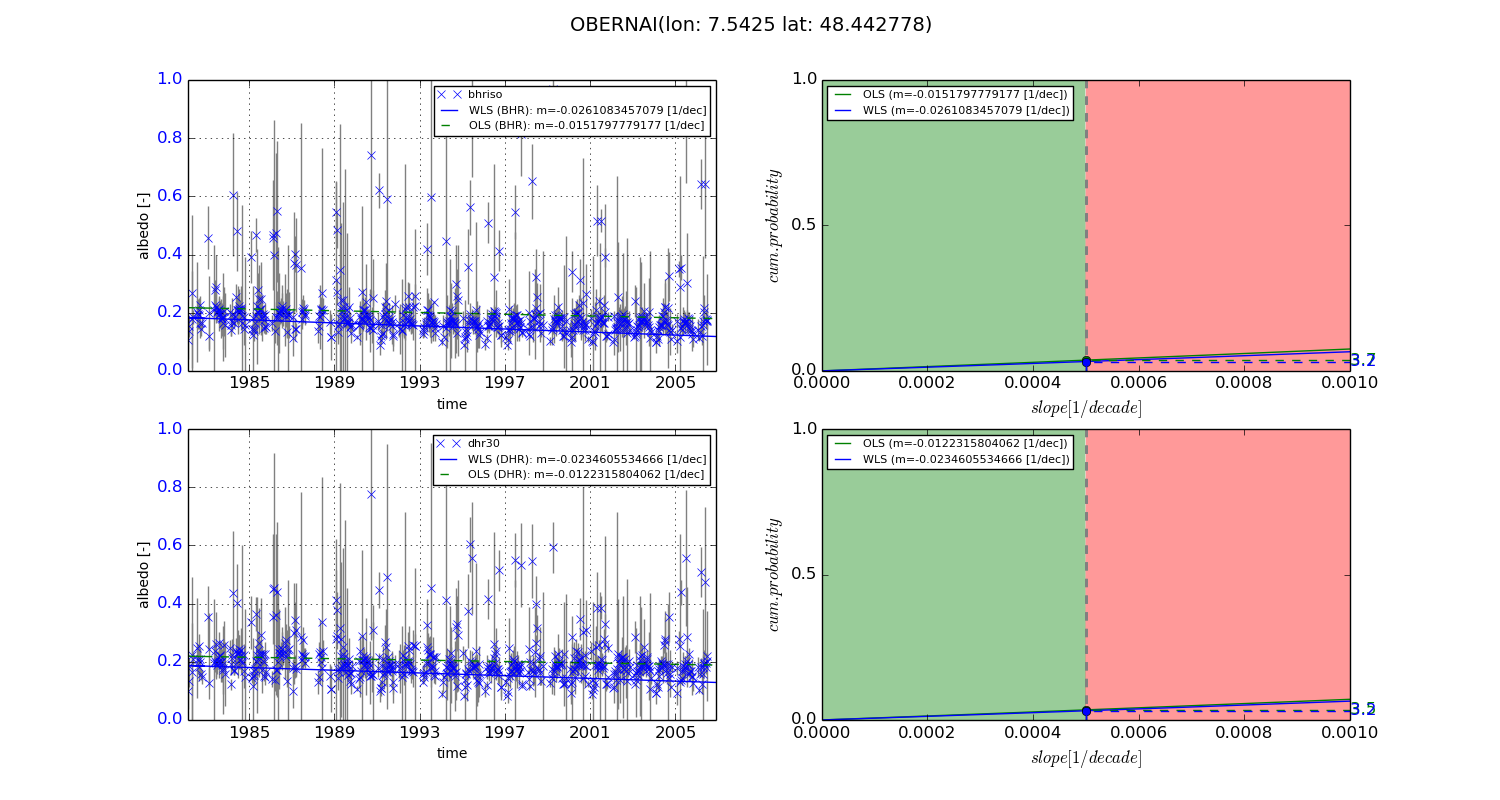
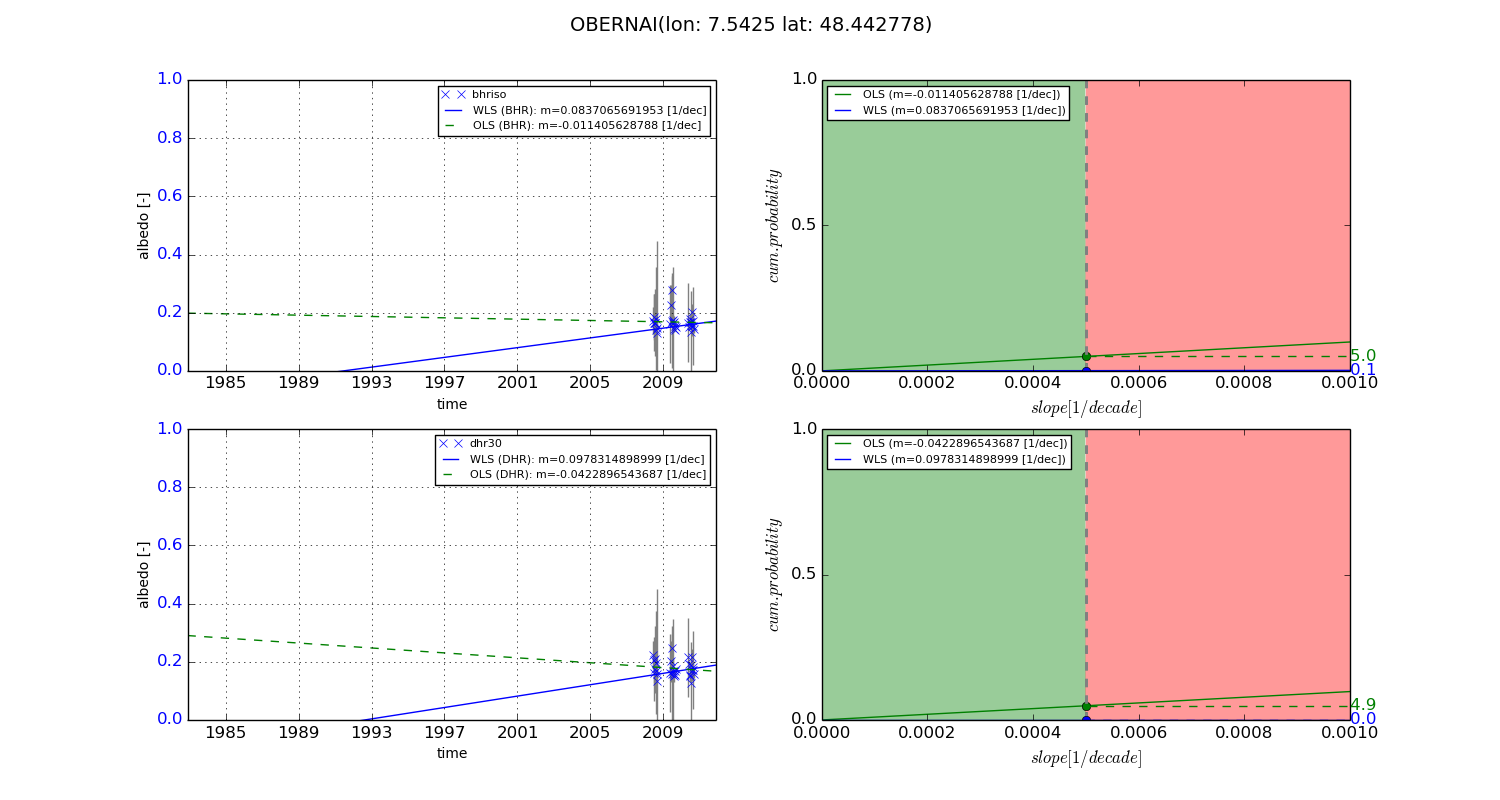
Temporal stability analysis

+000 deg (BHR)


BHR statistics

Temporal stability [1/decade]:


abs

rel


Weighted least square:

-0.0261083457079


Ordinary least square:

-0.0151797779177


Probabilities that GCOS criteria is met:

Weighted least square:

3.2 %

Ordinary least square:

3.7 %


DHR statistics

Temporal stability [1/decade]:


abs

rel


Weighted least square:

-0.0234605534666


Ordinary least square:

-0.0122315804062


Probabilities that GCOS criteria is met:

Weighted least square:

3.2 %

Ordinary least square:

3.5 %


+057/+063 deg (BHR)


BHR statistics

Temporal stability [1/decade]:


abs

rel


Weighted least square:

0.0837065691953


Ordinary least square:

-0.011405628788


Probabilities that GCOS criteria is met:

Weighted least square:

0.1 %

Ordinary least square:

5.0 %


DHR statistics

Temporal stability [1/decade]:


abs

rel


Weighted least square:

0.0978314898999


Ordinary least square:

-0.0422896543687


Probabilities that GCOS criteria is met:

Weighted least square:

0.0 %

Ordinary least square:

4.9 %


Temporal anomaly analyis

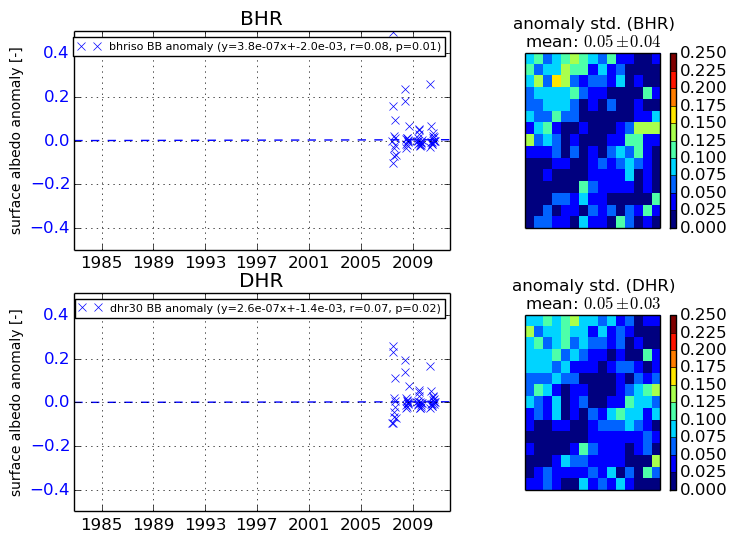
The variance of the temporal anomalies provides an additional measure about the stability of the signal AFTER removal of the mean seasonal cylce.
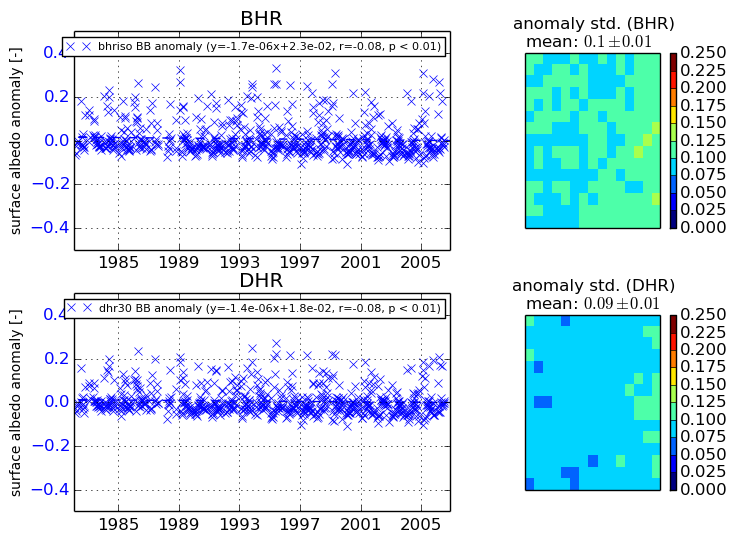
+000 deg


+057/+063 deg