OBS-SSA


Location

lon / lat [deg]: -105.12 / 53.985

Source network: AERONET


Geostationary surface albedo (GSA) data


“+000”


“+057/+063”


Landcover information (based on ESA CCI landcover data)


Landcover fractions @ 2km distance


Landcover fractions @ 20 km distance


Legend


Distance to open water bodies [km]:

4.38

Distance to urban areas [km]:

none in region


Radius: 1 km

Number of landcover classes:

1

Dominant landcover type:

70: Tree cover, needleleaved, evergreen, closed to open (>15%)

Fraction of dominant landcover type [%]:

100.0


Radius: 2 km

Number of landcover classes:

2

Dominant landcover type:

70: Tree cover, needleleaved, evergreen, closed to open (>15%)

Fraction of dominant landcover type [%]:

98.0


Radius: 5 km

Number of landcover classes:

2

Dominant landcover type:

70: Tree cover, needleleaved, evergreen, closed to open (>15%)

Fraction of dominant landcover type [%]:

96.0


Radius: 10 km

Number of landcover classes:

4

Dominant landcover type:

70: Tree cover, needleleaved, evergreen, closed to open (>15%)

Fraction of dominant landcover type [%]:

82.0


Radius: 20 km

Number of landcover classes:

6

Dominant landcover type:

70: Tree cover, needleleaved, evergreen, closed to open (>15%)

Fraction of dominant landcover type [%]:

83.0


Disturbances


Heterogeneity analysis

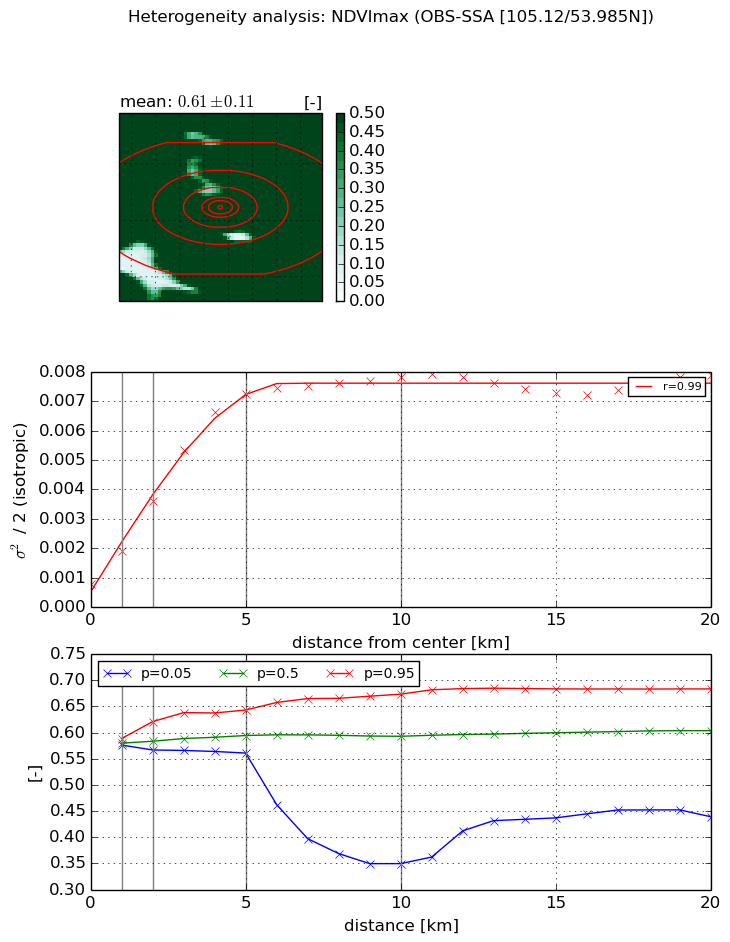
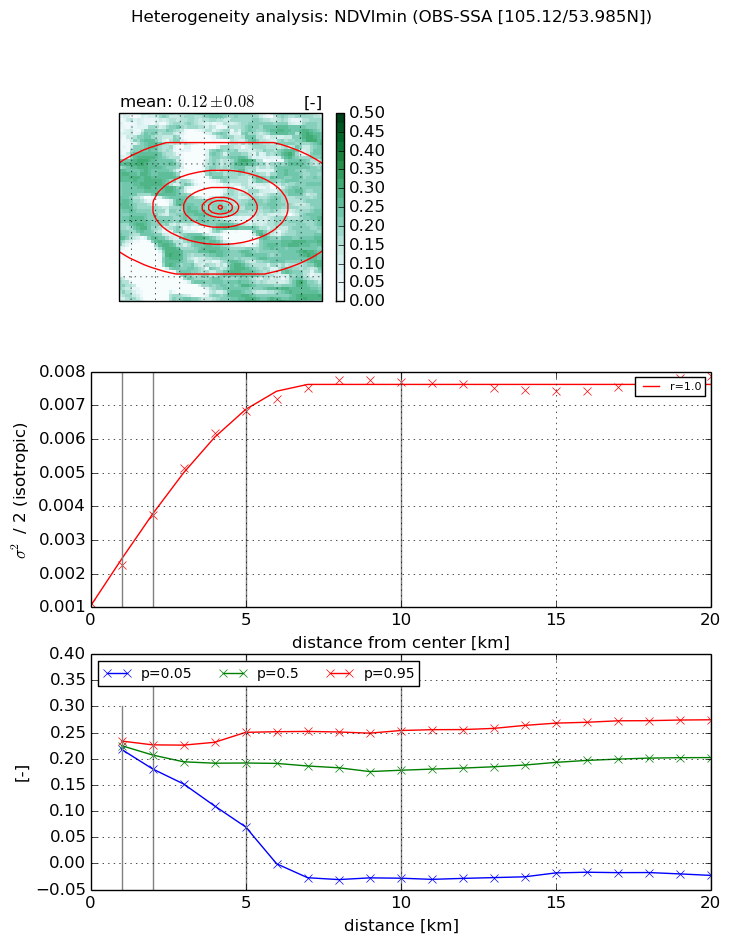
The heterogeneity analysis provides information about the spatial and temporal heterogeneity of the site.

Topography


Roman et al. (2009) index


St

0.000362588694107

Rcv

0.136041735582

Rse

0.0

Rst

-0.00962550555847

Rsv

8273.69201374


Height range @ 1km [m]

6

Height range @ 2km [m]

30

Height range @ 5km [m]

66

Height range @ 10km [m]

-999

Height range @ 20km [m]

-999


Variance slope @ 1 km

105

Variance slope @ 2 km

120

Variance slope @ 5 km

83

Variance slope @ 10 km

-999

Variance slope @ 20 km

-999


NDVI (max. NDVI composite)


Roman et al. (2009) index


St

1.4624572449

Rcv

0.876906594819

Rse

0.0

Rst

-0.174435706989

Rsv

-0.99999971893


NDVI range @ 1km [-]

0.01

NDVI range @ 2km [-]

0.05

NDVI range @ 5km [-]

0.08

NDVI range @ 10km [-]

0.32

NDVI range @ 20km [-]

0.24


Variance slope @ 1 km

0.00111068334368

Variance slope @ 2 km

0.0014112929137

Variance slope @ 5 km

0.00137485962178

Variance slope @ 10 km

0.000685534131686

Variance slope @ 20 km

0.000227889622856


NDVI (min. NDVI composite)I


Roman et al. (2009) index


St

1.16269636558

Rcv

1.53337297463

Rse

0.0

Rst

0.0468365606727

Rsv

-0.999999785735


NDVI range @ 1km [-]

0.02

NDVI range @ 2km [-]

0.05

NDVI range @ 5km [-]

0.18

NDVI range @ 10km [-]

0.28

NDVI range @ 20km [-]

0.3


NDVI slope @ 1 km

0.00111092296165

NDVI slope @ 2 km

0.00130967362799

NDVI slope @ 5 km

0.00119481628052

NDVI slope @ 10 km

0.000662054988902

NDVI slope @ 20 km

0.000230532292846


Temporal stability analysis

+000 deg (BHR)


BHR statistics

Temporal stability [1/decade]:


abs

rel


Weighted least square:

None


Ordinary least square:

None


Probabilities that GCOS criteria is met:

Weighted least square:

None %

Ordinary least square:

None %


DHR statistics

Temporal stability [1/decade]:


abs

rel


Weighted least square:

None


Ordinary least square:

None


Probabilities that GCOS criteria is met:

Weighted least square:

None %

Ordinary least square:

None %


+057/+063 deg (BHR)


BHR statistics

Temporal stability [1/decade]:


abs

rel


Weighted least square:

None


Ordinary least square:

None


Probabilities that GCOS criteria is met:

Weighted least square:

None %

Ordinary least square:

None %


DHR statistics

Temporal stability [1/decade]:


abs

rel


Weighted least square:

None


Ordinary least square:

None


Probabilities that GCOS criteria is met:

Weighted least square:

None %

Ordinary least square:

None %


Temporal anomaly analyis

The variance of the temporal anomalies provides an additional measure about the stability of the signal AFTER removal of the mean seasonal cylce.

+000 deg


+057/+063 deg