OMANI_DESERT


Location

lon / lat [deg]: 55.5 / 19.0

Source network: ALBEDOVAL1


Geostationary surface albedo (GSA) data


“+000”


“+057/+063”


Landcover information (based on ESA CCI landcover data)


Landcover fractions @ 2km distance


Landcover fractions @ 20 km distance


Legend


Distance to open water bodies [km]:

6.53

Distance to urban areas [km]:

none in region


Radius: 1 km

Number of landcover classes:

1

Dominant landcover type:

200: bare areas

Fraction of dominant landcover type [%]:

100.0


Radius: 2 km

Number of landcover classes:

1

Dominant landcover type:

200: bare areas

Fraction of dominant landcover type [%]:

100.0


Radius: 5 km

Number of landcover classes:

1

Dominant landcover type:

200: bare areas

Fraction of dominant landcover type [%]:

100.0


Radius: 10 km

Number of landcover classes:

1

Dominant landcover type:

200: bare areas

Fraction of dominant landcover type [%]:

99.0


Radius: 20 km

Number of landcover classes:

1

Dominant landcover type:

200: bare areas

Fraction of dominant landcover type [%]:

100.0


Disturbances


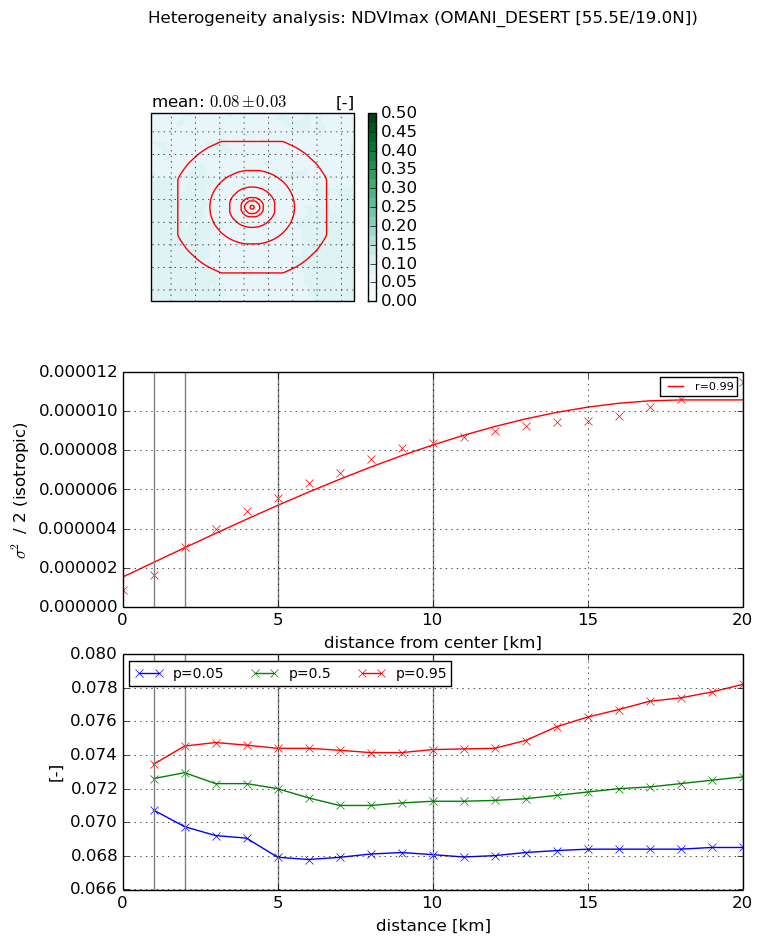
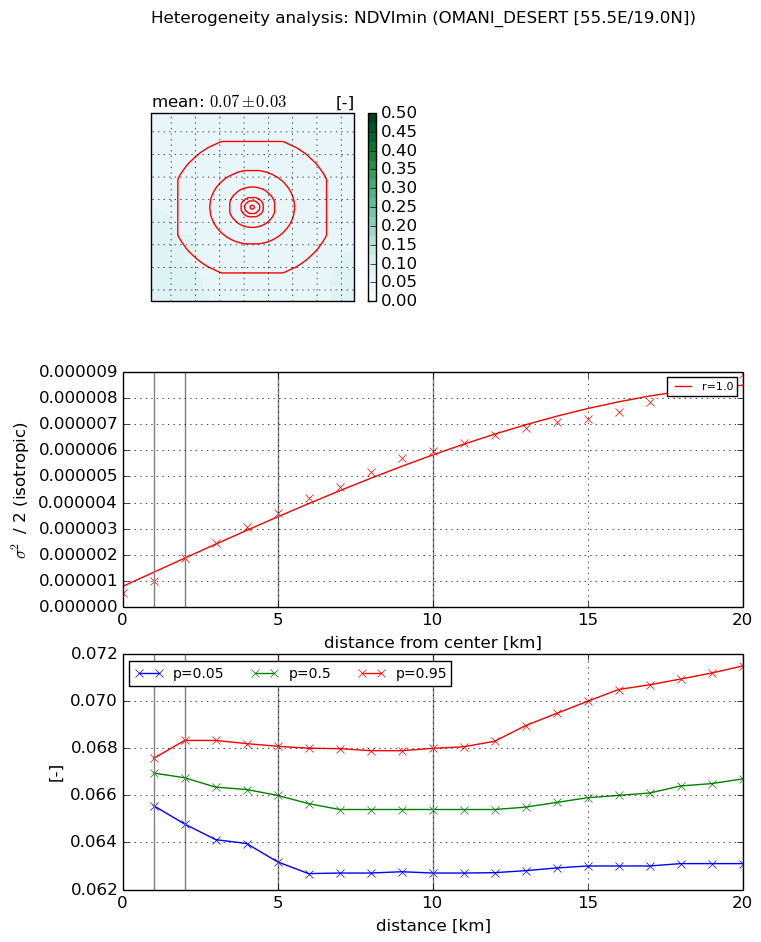
Heterogeneity analysis

The heterogeneity analysis provides information about the spatial and temporal heterogeneity of the site.

Topography


Roman et al. (2009) index


St

2.70301027732

Rcv

0.173421621838

Rse

0.0

Rst

-6.10321178788e-08

Rsv

-0.936452010607


Height range @ 1km [m]

6

Height range @ 2km [m]

12

Height range @ 5km [m]

19

Height range @ 10km [m]

-999

Height range @ 20km [m]

-999


Variance slope @ 1 km

8

Variance slope @ 2 km

8

Variance slope @ 5 km

6

Variance slope @ 10 km

-999

Variance slope @ 20 km

-999


NDVI (max. NDVI composite)


Roman et al. (2009) index


St

3.07908412191e-07

Rcv

0.0645867452006

Rse

0.0

Rst

0.466156837411

Rsv

9743156.46408


NDVI range @ 1km [-]

0.0

NDVI range @ 2km [-]

0.0

NDVI range @ 5km [-]

0.01

NDVI range @ 10km [-]

0.01

NDVI range @ 20km [-]

0.01


Variance slope @ 1 km

7.69478663546e-07

Variance slope @ 2 km

1.09792767658e-06

Variance slope @ 5 km

9.73775702194e-07

Variance slope @ 10 km

7.60711968032e-07

Variance slope @ 20 km

4.7533052472e-07


NDVI (min. NDVI composite)I


Roman et al. (2009) index


St

6.47357347655e-06

Rcv

0.0904553716741

Rse

0.0

Rst

0.365280364089

Rsv

463422.105368


NDVI range @ 1km [-]

0.0

NDVI range @ 2km [-]

0.0

NDVI range @ 5km [-]

0.0

NDVI range @ 10km [-]

0.01

NDVI range @ 20km [-]

0.01


NDVI slope @ 1 km

4.52251090987e-07

NDVI slope @ 2 km

6.63742355368e-07

NDVI slope @ 5 km

6.35050565568e-07

NDVI slope @ 10 km

5.57616535692e-07

NDVI slope @ 20 km

3.98234307962e-07


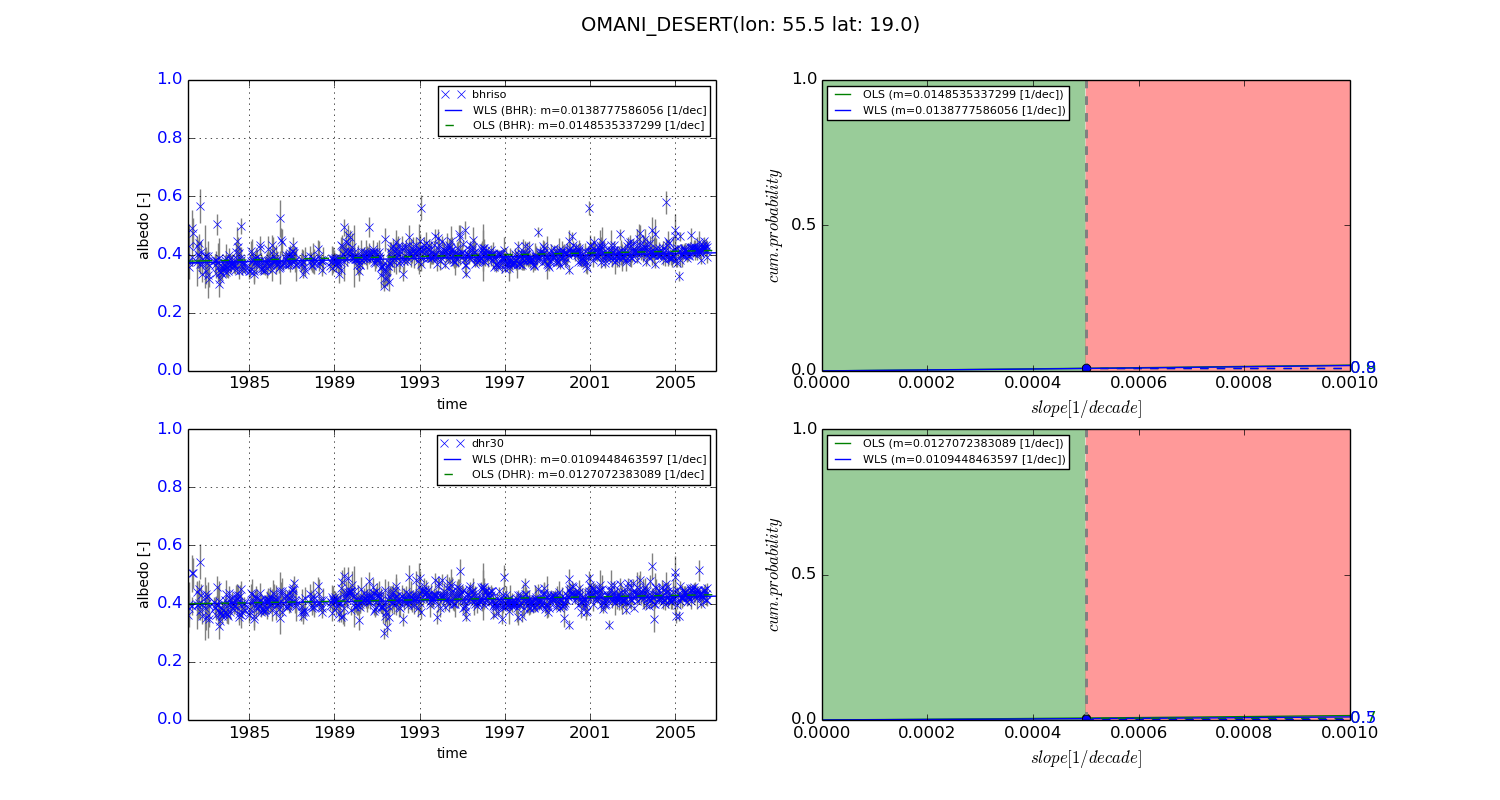
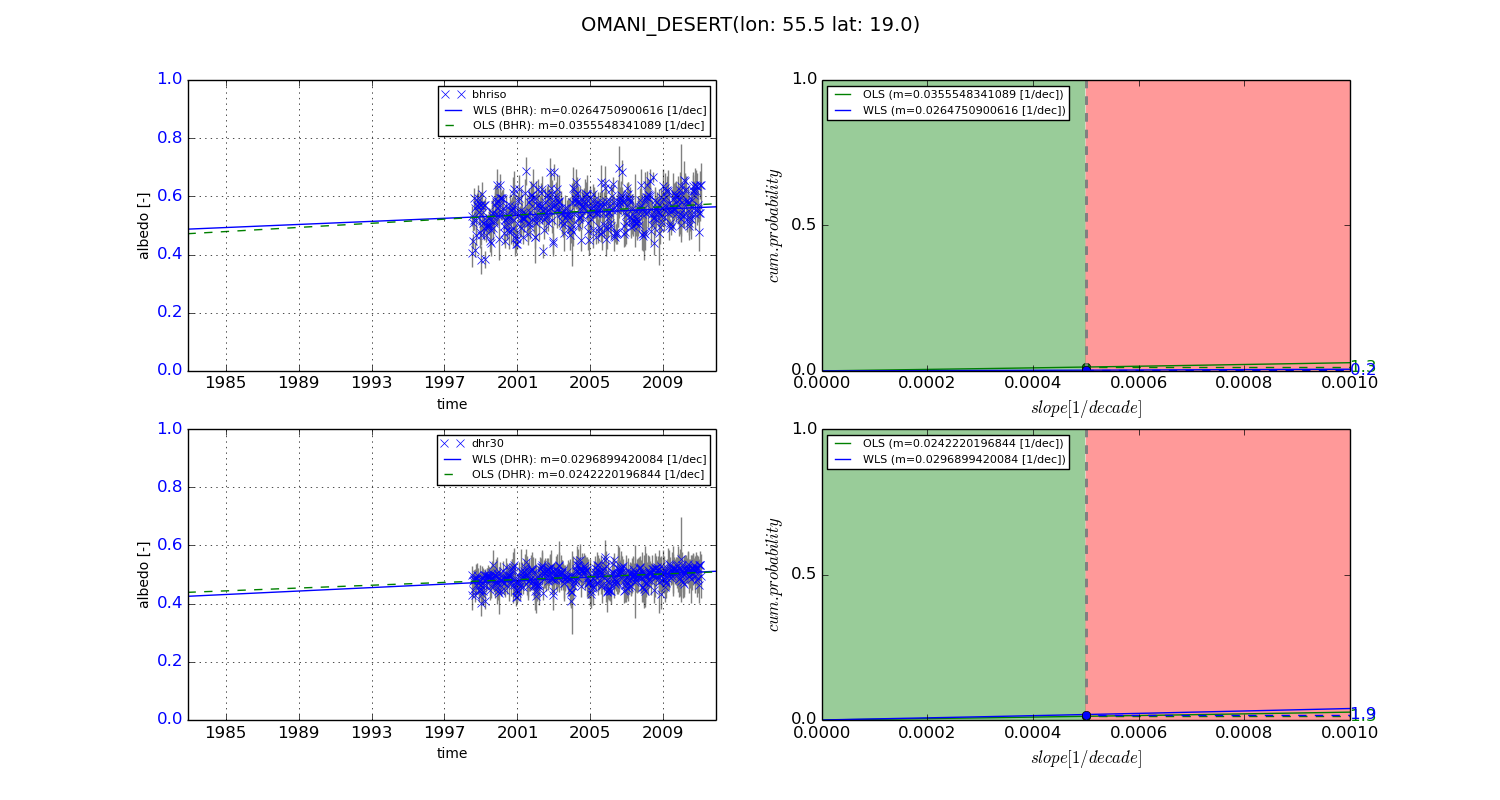
Temporal stability analysis

+000 deg (BHR)


BHR statistics

Temporal stability [1/decade]:


abs

rel


Weighted least square:

0.0138777586056


Ordinary least square:

0.0148535337299


Probabilities that GCOS criteria is met:

Weighted least square:

0.8 %

Ordinary least square:

0.9 %


DHR statistics

Temporal stability [1/decade]:


abs

rel


Weighted least square:

0.0109448463597


Ordinary least square:

0.0127072383089


Probabilities that GCOS criteria is met:

Weighted least square:

0.5 %

Ordinary least square:

0.7 %


+057/+063 deg (BHR)


BHR statistics

Temporal stability [1/decade]:


abs

rel


Weighted least square:

0.0264750900616


Ordinary least square:

0.0355548341089


Probabilities that GCOS criteria is met:

Weighted least square:

0.2 %

Ordinary least square:

1.3 %


DHR statistics

Temporal stability [1/decade]:


abs

rel


Weighted least square:

0.0296899420084


Ordinary least square:

0.0242220196844


Probabilities that GCOS criteria is met:

Weighted least square:

1.9 %

Ordinary least square:

1.3 %


Temporal anomaly analyis

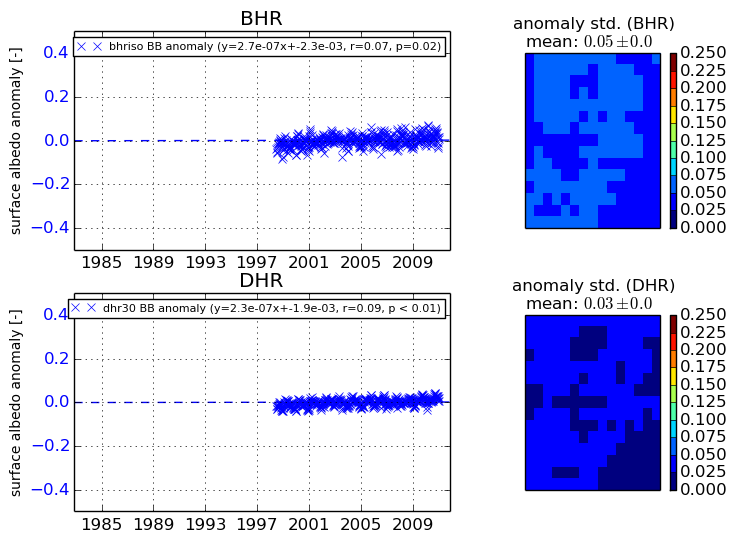
The variance of the temporal anomalies provides an additional measure about the stability of the signal AFTER removal of the mean seasonal cylce.
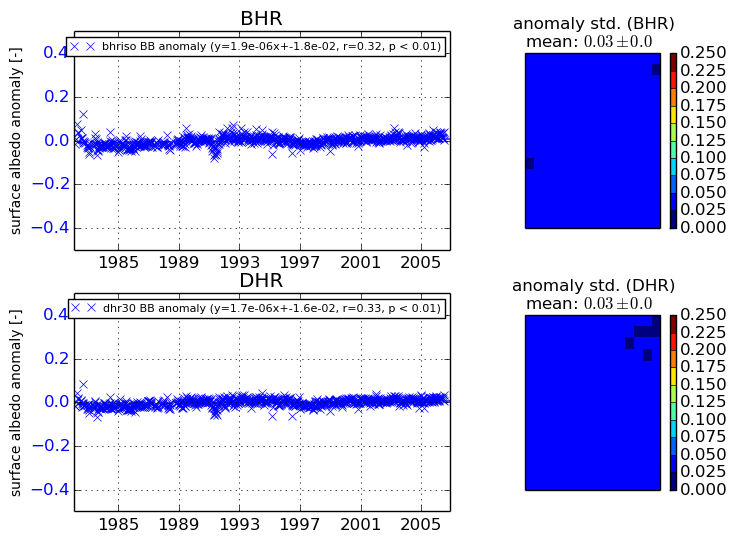
+000 deg


+057/+063 deg