OUAGADOUGOU


Location

lon / lat [deg]: -1.4 / 12.2

Source network: AERONET


Geostationary surface albedo (GSA) data


“+000”


“+057/+063”


Landcover information (based on ESA CCI landcover data)


Landcover fractions @ 2km distance


Landcover fractions @ 20 km distance


Legend


Distance to open water bodies [km]:

0.49

Distance to urban areas [km]:

1.4


Radius: 1 km

Number of landcover classes:

2

Dominant landcover type:

10: cropland, rainfed

Fraction of dominant landcover type [%]:

91.0


Radius: 2 km

Number of landcover classes:

3

Dominant landcover type:

10: cropland, rainfed

Fraction of dominant landcover type [%]:

80.0


Radius: 5 km

Number of landcover classes:

2

Dominant landcover type:

10: cropland, rainfed

Fraction of dominant landcover type [%]:

92.0


Radius: 10 km

Number of landcover classes:

2

Dominant landcover type:

10: cropland, rainfed

Fraction of dominant landcover type [%]:

95.0


Radius: 20 km

Number of landcover classes:

3

Dominant landcover type:

10: cropland, rainfed

Fraction of dominant landcover type [%]:

92.0


Disturbances


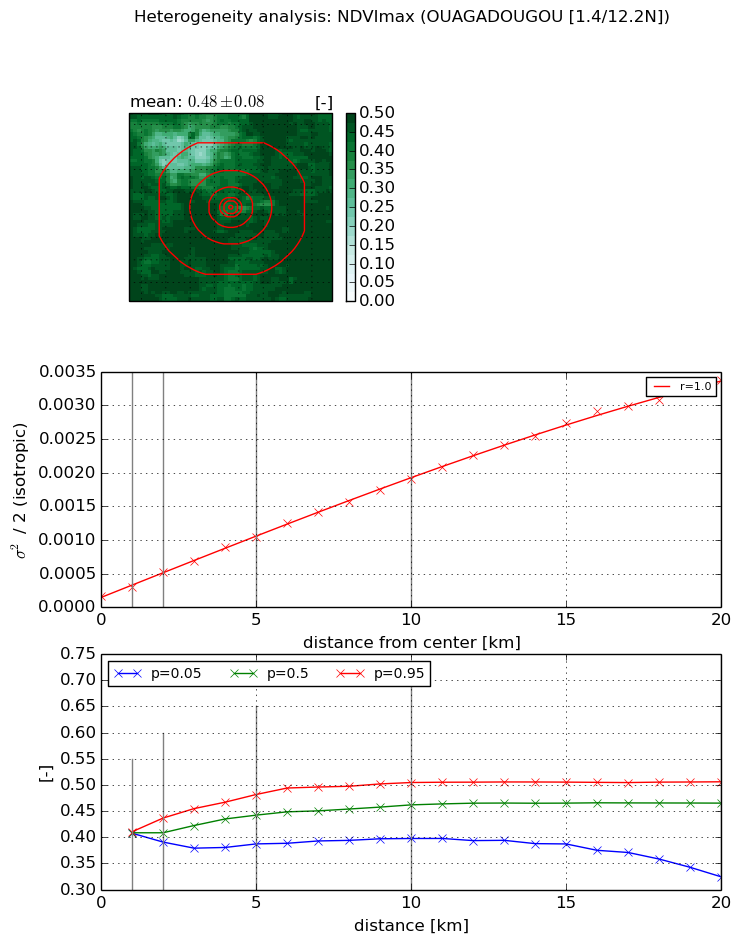
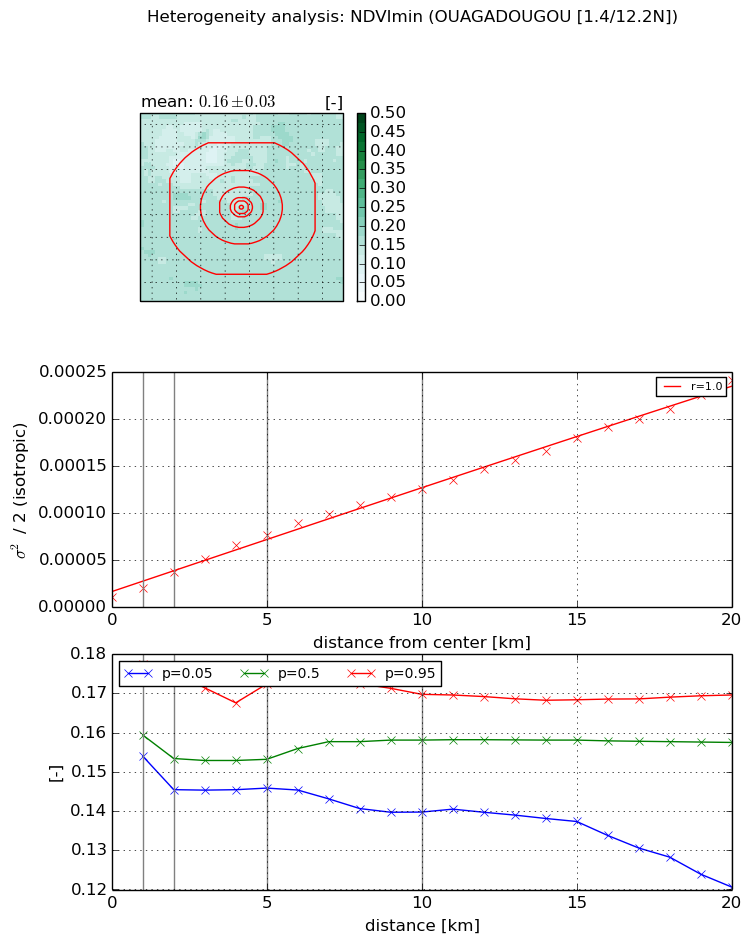
Heterogeneity analysis

The heterogeneity analysis provides information about the spatial and temporal heterogeneity of the site.

Topography


Roman et al. (2009) index


St

7.67519126284

Rcv

0.120984558531

Rse

0.0

Rst

-0.0231702060411

Rsv

0.246714973688


Height range @ 1km [m]

13

Height range @ 2km [m]

19

Height range @ 5km [m]

23

Height range @ 10km [m]

-999

Height range @ 20km [m]

-999


Variance slope @ 1 km

16

Variance slope @ 2 km

18

Variance slope @ 5 km

14

Variance slope @ 10 km

-999

Variance slope @ 20 km

-999


NDVI (max. NDVI composite)


Roman et al. (2009) index


St

8.88292117683

Rcv

0.132684819941

Rse

0.0

Rst

0.135809954678

Rsv

0.069231964173


NDVI range @ 1km [-]

0.0

NDVI range @ 2km [-]

0.05

NDVI range @ 5km [-]

0.09

NDVI range @ 10km [-]

0.11

NDVI range @ 20km [-]

0.18


Variance slope @ 1 km

0.000135547846769

Variance slope @ 2 km

0.000175448396881

Variance slope @ 5 km

0.000181499759359

Variance slope @ 10 km

0.000176688033707

Variance slope @ 20 km

0.000162939355673


NDVI (min. NDVI composite)I


Roman et al. (2009) index


St

1.20273598693

Rcv

-0.129131069663

Rse

0.0

Rst

-0.526561313909

Rsv

1.83862060997


NDVI range @ 1km [-]

0.02

NDVI range @ 2km [-]

0.03

NDVI range @ 5km [-]

0.03

NDVI range @ 10km [-]

0.03

NDVI range @ 20km [-]

0.05


NDVI slope @ 1 km

9.74035497929e-06

NDVI slope @ 2 km

1.29359771394e-05

NDVI slope @ 5 km

1.37101794482e-05

NDVI slope @ 10 km

1.17717024151e-05

NDVI slope @ 20 km

1.09252797902e-05


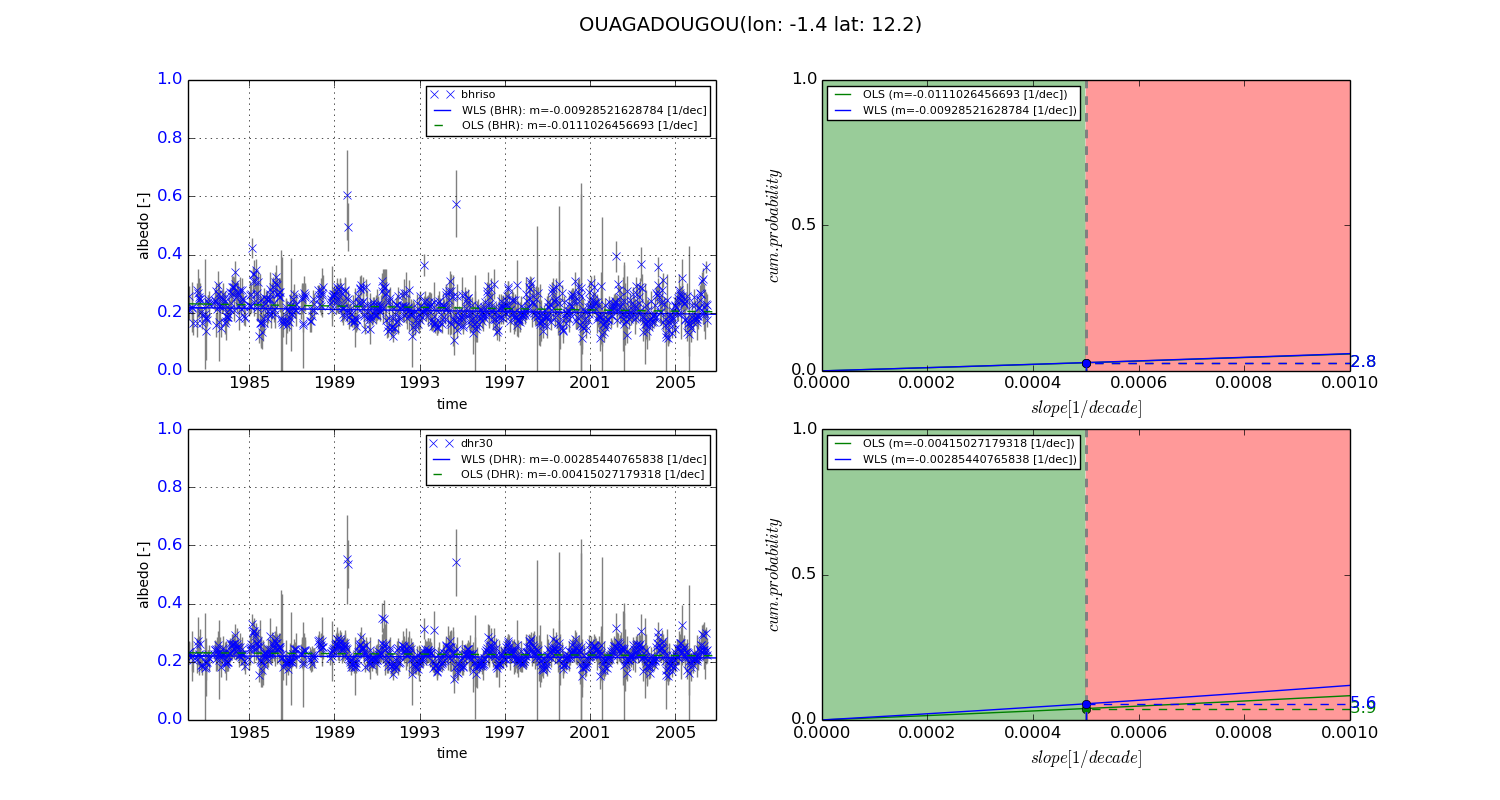
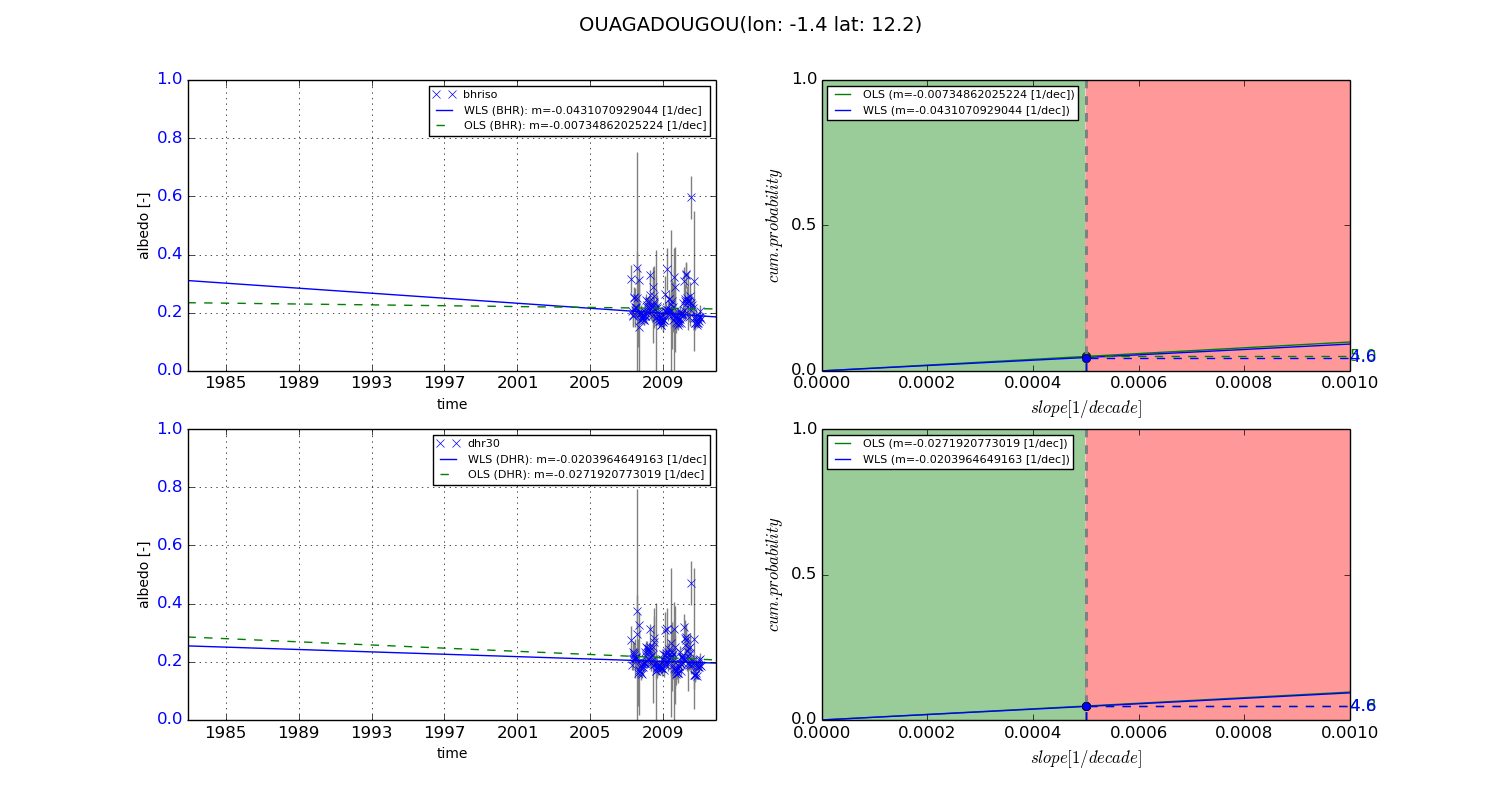
Temporal stability analysis

+000 deg (BHR)


BHR statistics

Temporal stability [1/decade]:


abs

rel


Weighted least square:

-0.00928521628784


Ordinary least square:

-0.0111026456693


Probabilities that GCOS criteria is met:

Weighted least square:

2.8 %

Ordinary least square:

2.8 %


DHR statistics

Temporal stability [1/decade]:


abs

rel


Weighted least square:

-0.00285440765838


Ordinary least square:

-0.00415027179318


Probabilities that GCOS criteria is met:

Weighted least square:

5.6 %

Ordinary least square:

3.9 %


+057/+063 deg (BHR)


BHR statistics

Temporal stability [1/decade]:


abs

rel


Weighted least square:

-0.0431070929044


Ordinary least square:

-0.00734862025224


Probabilities that GCOS criteria is met:

Weighted least square:

4.6 %

Ordinary least square:

5.0 %


DHR statistics

Temporal stability [1/decade]:


abs

rel


Weighted least square:

-0.0203964649163


Ordinary least square:

-0.0271920773019


Probabilities that GCOS criteria is met:

Weighted least square:

4.6 %

Ordinary least square:

4.8 %


Temporal anomaly analyis

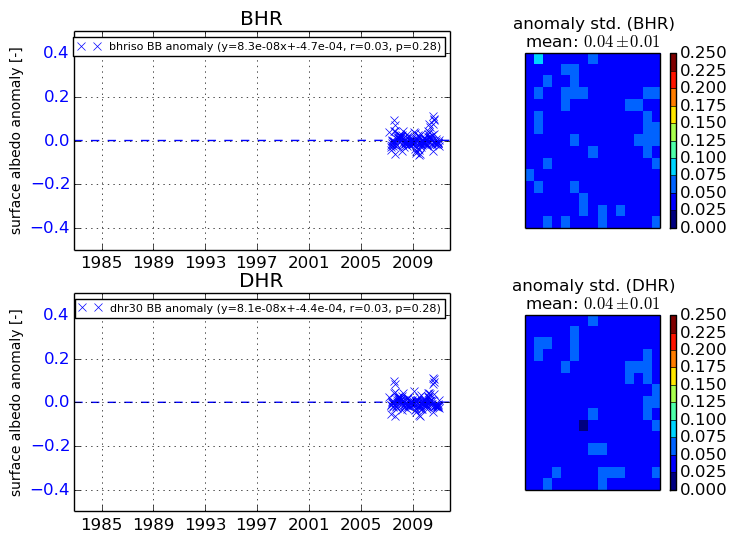
The variance of the temporal anomalies provides an additional measure about the stability of the signal AFTER removal of the mean seasonal cylce.
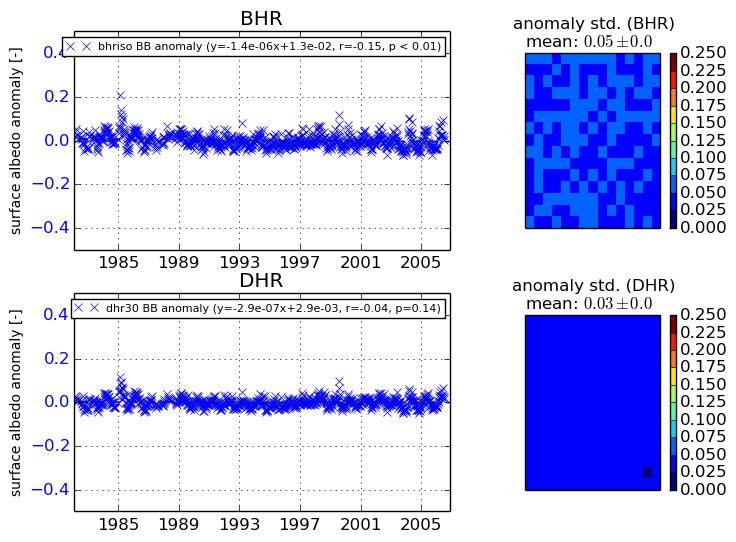
+000 deg


+057/+063 deg