OWENS_LAKE


Location

lon / lat [deg]: -117.8707 / 36.4878

Source network: AERONET


Geostationary surface albedo (GSA) data


“+000”


“+057/+063”


Landcover information (based on ESA CCI landcover data)


Landcover fractions @ 2km distance


Landcover fractions @ 20 km distance


Legend


Distance to open water bodies [km]:

2.21

Distance to urban areas [km]:

0.51


Radius: 1 km

Number of landcover classes:

2

Dominant landcover type:

120: Shrubland

Fraction of dominant landcover type [%]:

83.0


Radius: 2 km

Number of landcover classes:

3

Dominant landcover type:

120: Shrubland

Fraction of dominant landcover type [%]:

90.0


Radius: 5 km

Number of landcover classes:

4

Dominant landcover type:

120: Shrubland

Fraction of dominant landcover type [%]:

86.0


Radius: 10 km

Number of landcover classes:

3

Dominant landcover type:

120: Shrubland

Fraction of dominant landcover type [%]:

84.0


Radius: 20 km

Number of landcover classes:

4

Dominant landcover type:

120: Shrubland

Fraction of dominant landcover type [%]:

86.0


Disturbances


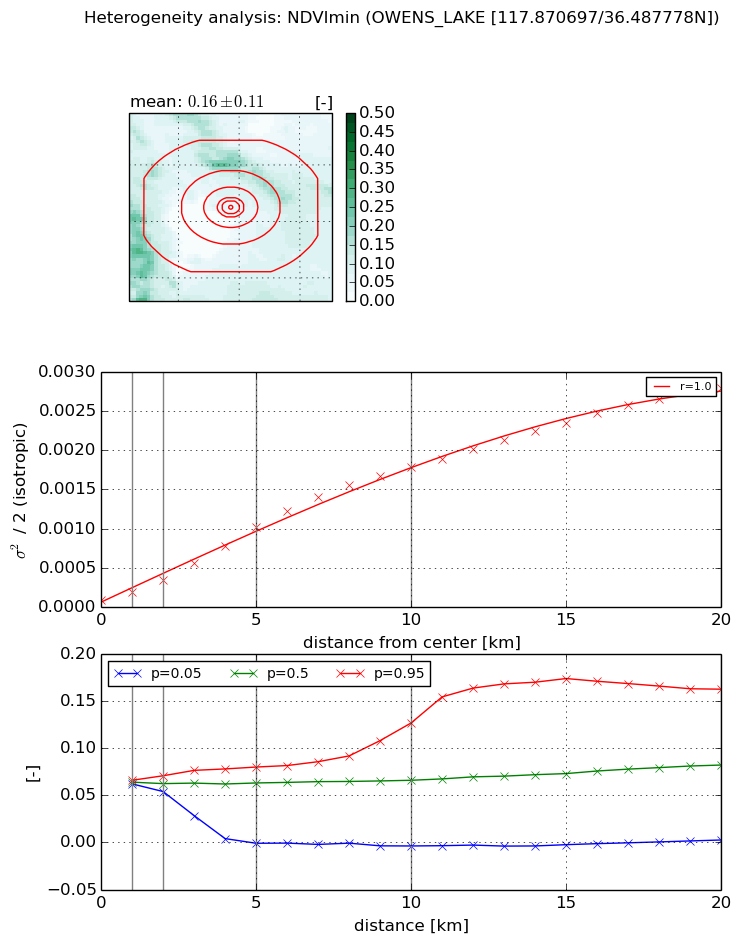
Heterogeneity analysis

The heterogeneity analysis provides information about the spatial and temporal heterogeneity of the site.

Topography


Roman et al. (2009) index


St

3.30391262342e-10

Rcv

0.889755664001

Rse

0.0

Rst

2.10924792299e-07

Rsv

9080143277.51


Height range @ 1km [m]

66

Height range @ 2km [m]

142

Height range @ 5km [m]

465

Height range @ 10km [m]

-999

Height range @ 20km [m]

-999


Variance slope @ 1 km

2236

Variance slope @ 2 km

3413

Variance slope @ 5 km

6242

Variance slope @ 10 km

-999

Variance slope @ 20 km

-999


NDVI (max. NDVI composite)


Roman et al. (2009) index


St

9.00303816788e-07

Rcv

1.0235324642

Rse

0.0

Rst

0.0242963434568

Rsv

3332207.41787


NDVI range @ 1km [-]

0.01

NDVI range @ 2km [-]

0.02

NDVI range @ 5km [-]

0.07

NDVI range @ 10km [-]

0.14

NDVI range @ 20km [-]

0.19


Variance slope @ 1 km

0.000179187037901

Variance slope @ 2 km

0.000206732857221

Variance slope @ 5 km

0.000296168097842

Variance slope @ 10 km

0.000269535829775

Variance slope @ 20 km

0.000183856705954


NDVI (min. NDVI composite)I


Roman et al. (2009) index


St

8.68752828588e-08

Rcv

1.09024029667

Rse

0.0

Rst

0.174757443612

Rsv

34532260.4012


NDVI range @ 1km [-]

0.0

NDVI range @ 2km [-]

0.02

NDVI range @ 5km [-]

0.08

NDVI range @ 10km [-]

0.13

NDVI range @ 20km [-]

0.16


NDVI slope @ 1 km

0.000108239802654

NDVI slope @ 2 km

0.000125772415672

NDVI slope @ 5 km

0.00018963390173

NDVI slope @ 10 km

0.000183257712606

NDVI slope @ 20 km

0.000138720837882


Temporal stability analysis

+000 deg (BHR)


BHR statistics

Temporal stability [1/decade]:


abs

rel


Weighted least square:

None


Ordinary least square:

None


Probabilities that GCOS criteria is met:

Weighted least square:

None %

Ordinary least square:

None %


DHR statistics

Temporal stability [1/decade]:


abs

rel


Weighted least square:

None


Ordinary least square:

None


Probabilities that GCOS criteria is met:

Weighted least square:

None %

Ordinary least square:

None %


+057/+063 deg (BHR)


BHR statistics

Temporal stability [1/decade]:


abs

rel


Weighted least square:

None


Ordinary least square:

None


Probabilities that GCOS criteria is met:

Weighted least square:

None %

Ordinary least square:

None %


DHR statistics

Temporal stability [1/decade]:


abs

rel


Weighted least square:

None


Ordinary least square:

None


Probabilities that GCOS criteria is met:

Weighted least square:

None %

Ordinary least square:

None %


Temporal anomaly analyis

The variance of the temporal anomalies provides an additional measure about the stability of the signal AFTER removal of the mean seasonal cylce.

+000 deg


+057/+063 deg