PAARDEFONTEIN


Location

lon / lat [deg]: 28.3747 / -25.496

Source network: AERONET


Geostationary surface albedo (GSA) data


“+000”


“+057/+063”


Landcover information (based on ESA CCI landcover data)


Landcover fractions @ 2km distance


Landcover fractions @ 20 km distance


Legend


Distance to open water bodies [km]:

13.7

Distance to urban areas [km]:

7.77


Radius: 1 km

Number of landcover classes:

3

Dominant landcover type:

10: cropland, rainfed

Fraction of dominant landcover type [%]:

65.0


Radius: 2 km

Number of landcover classes:

3

Dominant landcover type:

10: cropland, rainfed

Fraction of dominant landcover type [%]:

47.0


Radius: 5 km

Number of landcover classes:

5

Dominant landcover type:

10: cropland, rainfed

Fraction of dominant landcover type [%]:

45.0


Radius: 10 km

Number of landcover classes:

8

Dominant landcover type:

10: cropland, rainfed

Fraction of dominant landcover type [%]:

42.0


Radius: 20 km

Number of landcover classes:

8

Dominant landcover type:

10: cropland, rainfed

Fraction of dominant landcover type [%]:

41.0


Disturbances


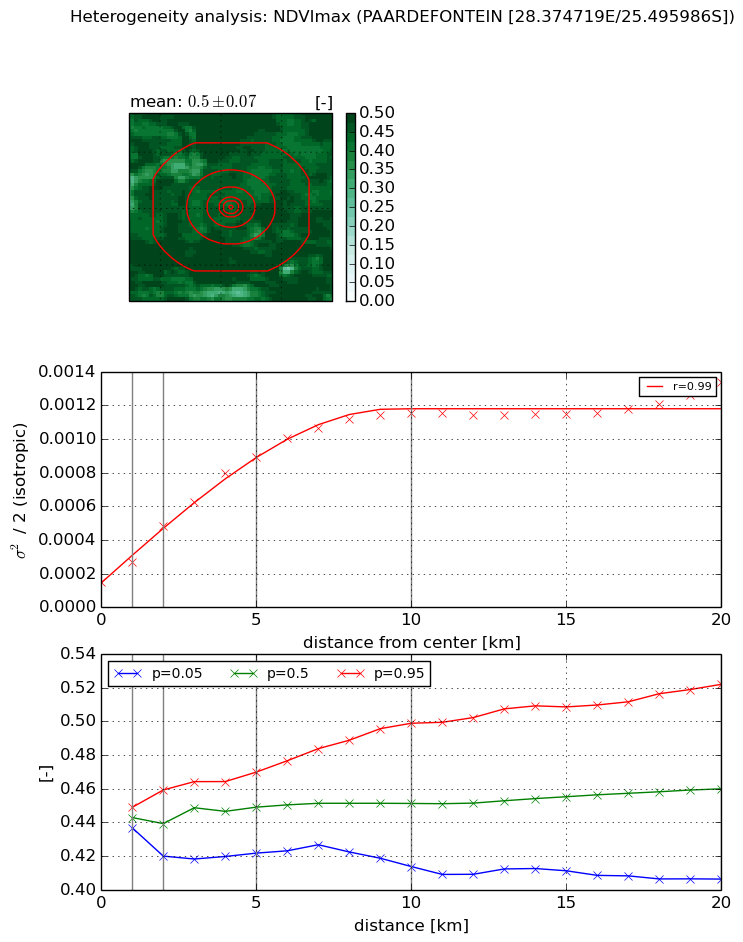
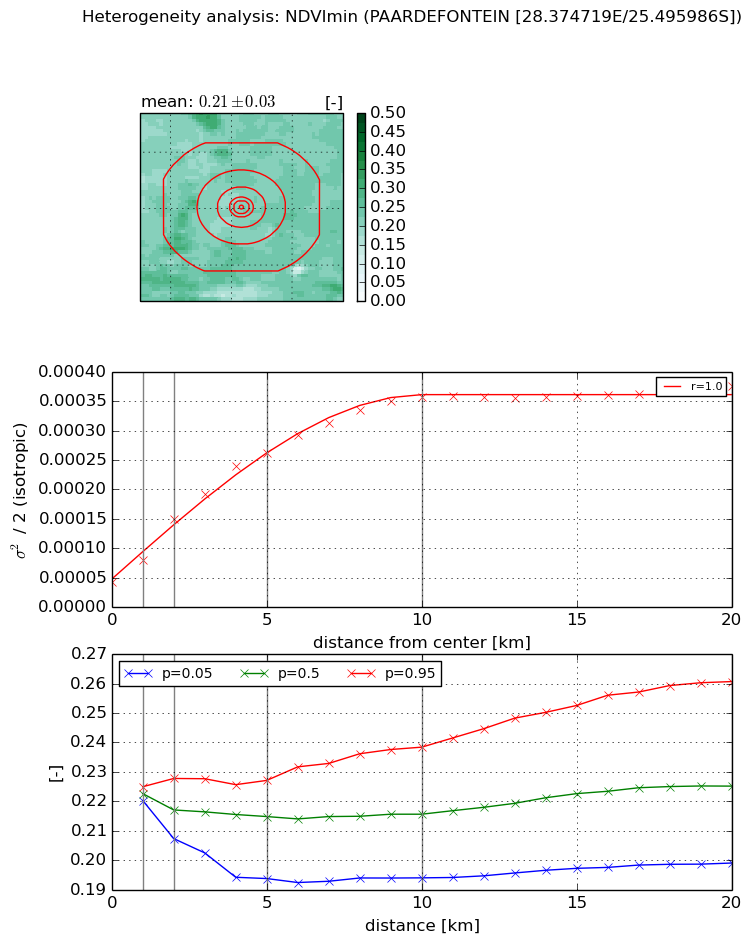
Heterogeneity analysis

The heterogeneity analysis provides information about the spatial and temporal heterogeneity of the site.

Topography


Roman et al. (2009) index


St

1.65143521279

Rcv

0.687108272777

Rse

0.0

Rst

-0.0352271214785

Rsv

1.09426629667


Height range @ 1km [m]

28

Height range @ 2km [m]

40

Height range @ 5km [m]

87

Height range @ 10km [m]

-999

Height range @ 20km [m]

-999


Variance slope @ 1 km

136

Variance slope @ 2 km

195

Variance slope @ 5 km

231

Variance slope @ 10 km

-999

Variance slope @ 20 km

-999


NDVI (max. NDVI composite)


Roman et al. (2009) index


St

13.415231766

Rcv

-0.0946711660389

Rse

0.0

Rst

0.06893560955

Rsv

0.06001962553


NDVI range @ 1km [-]

0.01

NDVI range @ 2km [-]

0.04

NDVI range @ 5km [-]

0.05

NDVI range @ 10km [-]

0.09

NDVI range @ 20km [-]

0.12


Variance slope @ 1 km

0.000119735483707

Variance slope @ 2 km

0.000167075959437

Variance slope @ 5 km

0.000155748486454

Variance slope @ 10 km

0.000104386524409

Variance slope @ 20 km

4.51489207506e-05


NDVI (min. NDVI composite)I


Roman et al. (2009) index


St

2.13910159296

Rcv

0.353681436735

Rse

0.0

Rst

-0.048776773989

Rsv

-0.999999722958


NDVI range @ 1km [-]

0.0

NDVI range @ 2km [-]

0.02

NDVI range @ 5km [-]

0.03

NDVI range @ 10km [-]

0.04

NDVI range @ 20km [-]

0.06


NDVI slope @ 1 km

3.68964221922e-05

NDVI slope @ 2 km

5.30391961828e-05

NDVI slope @ 5 km

4.61704182589e-05

NDVI slope @ 10 km

3.17951407265e-05

NDVI slope @ 20 km

1.36804019574e-05


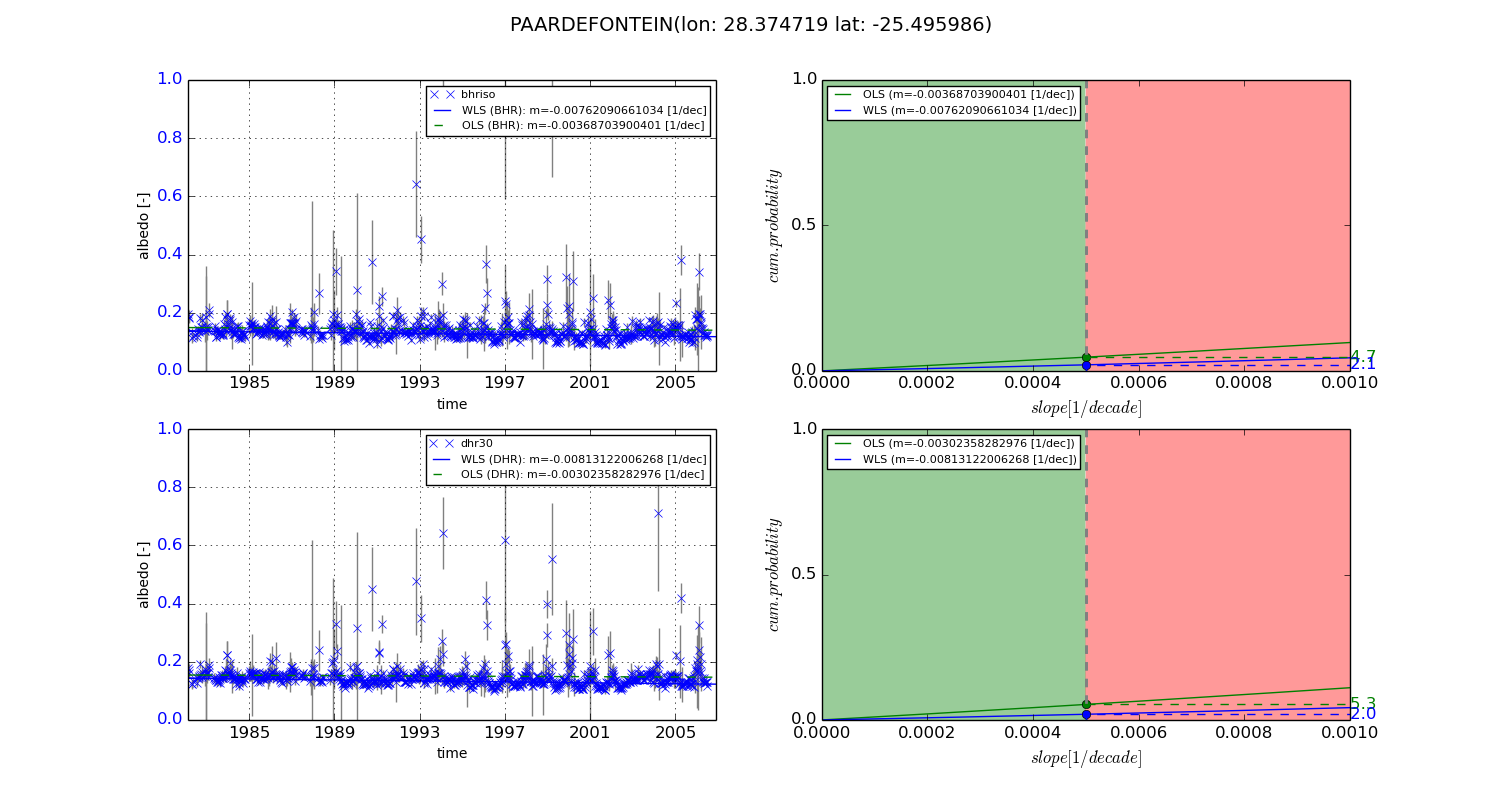
Temporal stability analysis

+000 deg (BHR)


BHR statistics

Temporal stability [1/decade]:


abs

rel


Weighted least square:

-0.00762090661034


Ordinary least square:

-0.00368703900401


Probabilities that GCOS criteria is met:

Weighted least square:

2.1 %

Ordinary least square:

4.7 %


DHR statistics

Temporal stability [1/decade]:


abs

rel


Weighted least square:

-0.00813122006268


Ordinary least square:

-0.00302358282976


Probabilities that GCOS criteria is met:

Weighted least square:

2.0 %

Ordinary least square:

5.3 %


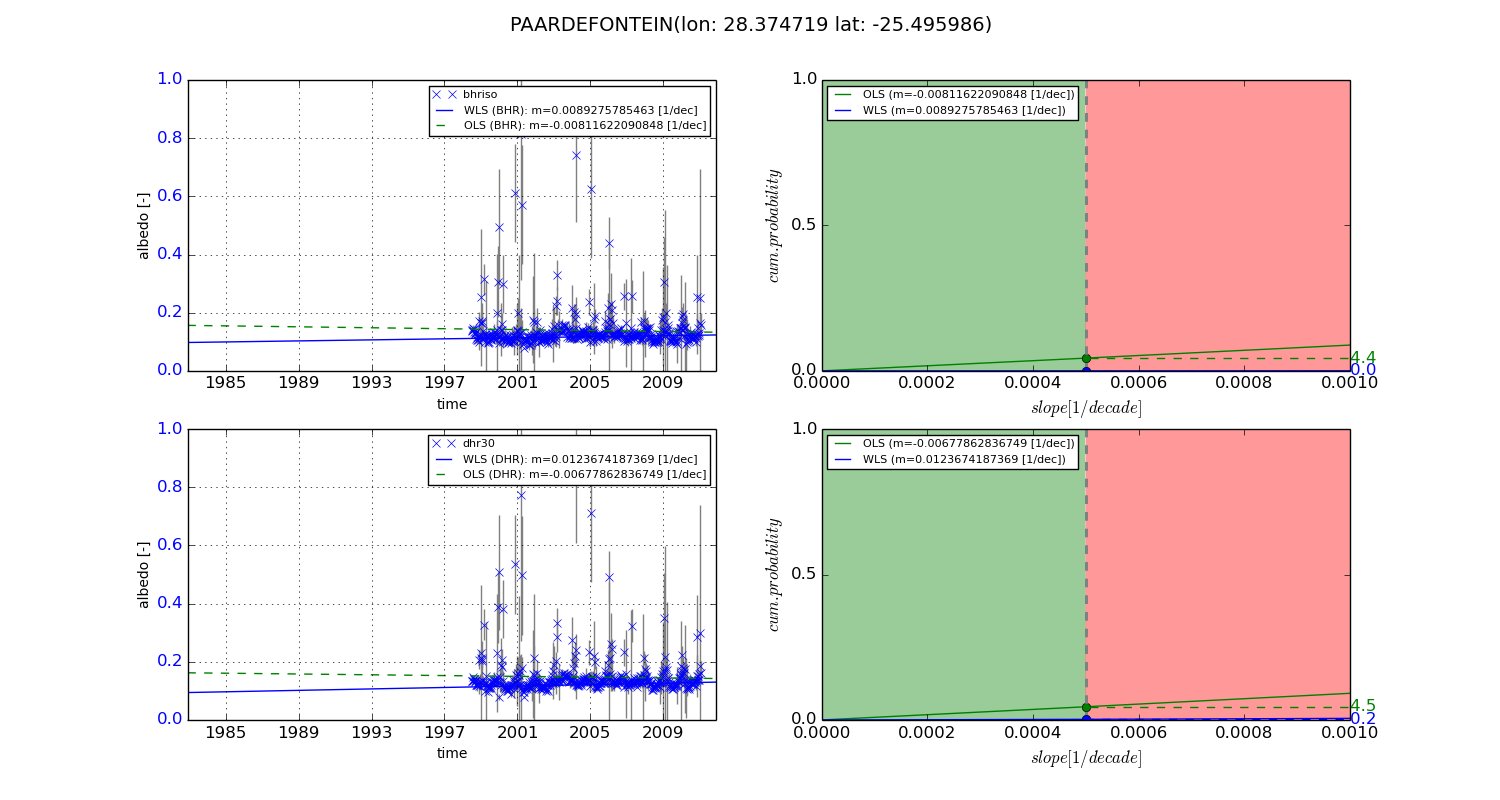
+057/+063 deg (BHR)


BHR statistics

Temporal stability [1/decade]:


abs

rel


Weighted least square:

0.0089275785463


Ordinary least square:

-0.00811622090848


Probabilities that GCOS criteria is met:

Weighted least square:

0.0 %

Ordinary least square:

4.4 %


DHR statistics

Temporal stability [1/decade]:


abs

rel


Weighted least square:

0.0123674187369


Ordinary least square:

-0.00677862836749


Probabilities that GCOS criteria is met:

Weighted least square:

0.2 %

Ordinary least square:

4.5 %


Temporal anomaly analyis

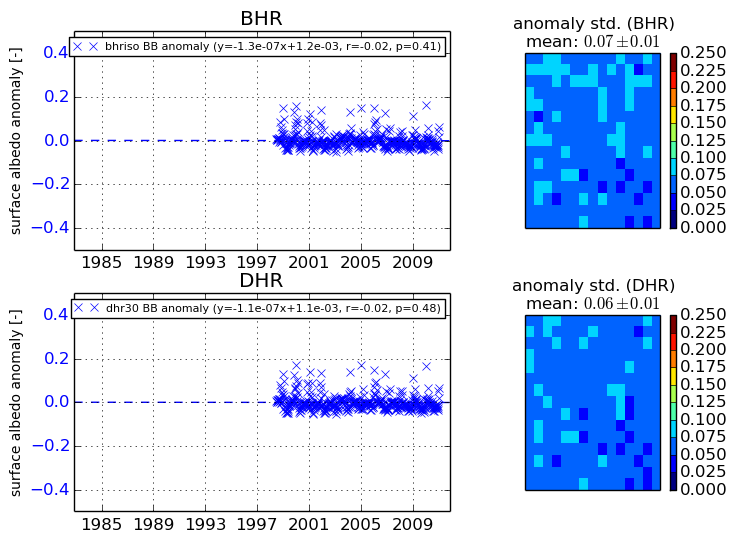
The variance of the temporal anomalies provides an additional measure about the stability of the signal AFTER removal of the mean seasonal cylce.
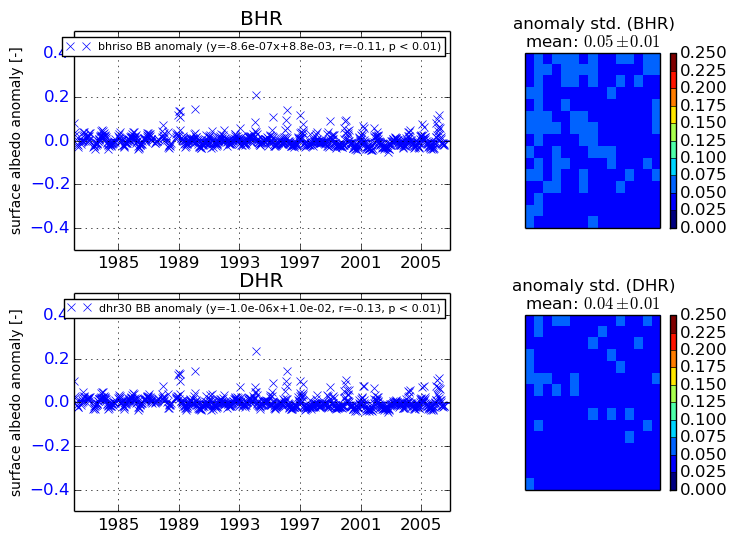
+000 deg


+057/+063 deg