PALAISEAU


Location

lon / lat [deg]: 2.2083 / 48.7

Source network: AERONET


Geostationary surface albedo (GSA) data


“+000”


“+057/+063”


Landcover information (based on ESA CCI landcover data)


Landcover fractions @ 2km distance


Landcover fractions @ 20 km distance


Legend


Distance to open water bodies [km]:

5.07

Distance to urban areas [km]:

0.19


Radius: 1 km

Number of landcover classes:

1

Dominant landcover type:

190: urban areas

Fraction of dominant landcover type [%]:

100.0


Radius: 2 km

Number of landcover classes:

2

Dominant landcover type:

190: urban areas

Fraction of dominant landcover type [%]:

98.0


Radius: 5 km

Number of landcover classes:

3

Dominant landcover type:

190: urban areas

Fraction of dominant landcover type [%]:

65.0


Radius: 10 km

Number of landcover classes:

3

Dominant landcover type:

190: urban areas

Fraction of dominant landcover type [%]:

58.0


Radius: 20 km

Number of landcover classes:

3

Dominant landcover type:

190: urban areas

Fraction of dominant landcover type [%]:

59.0


Disturbances


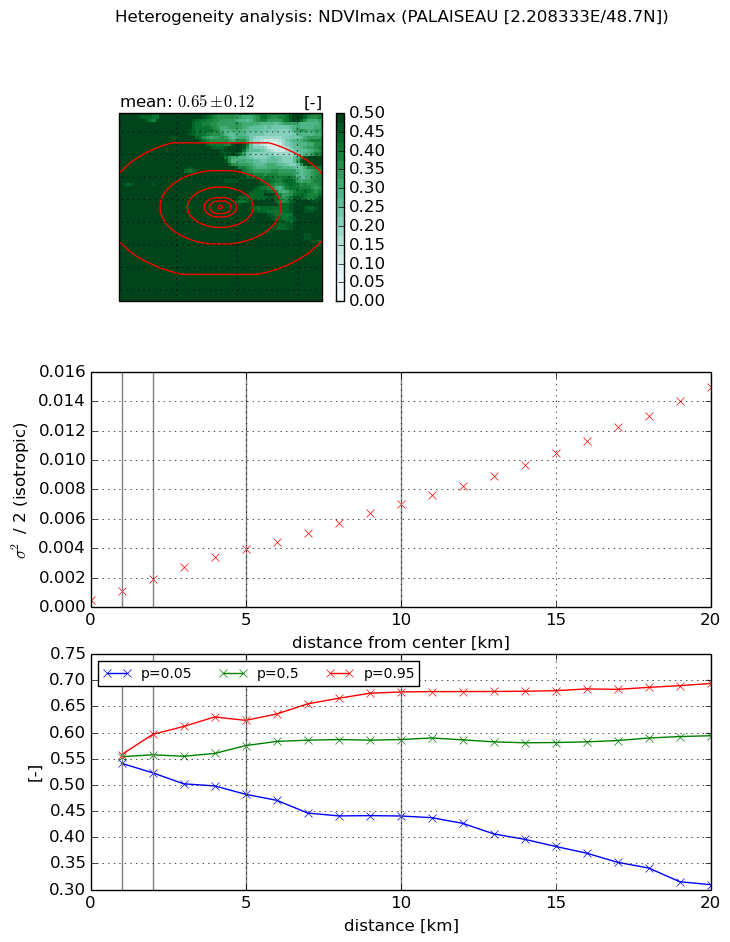
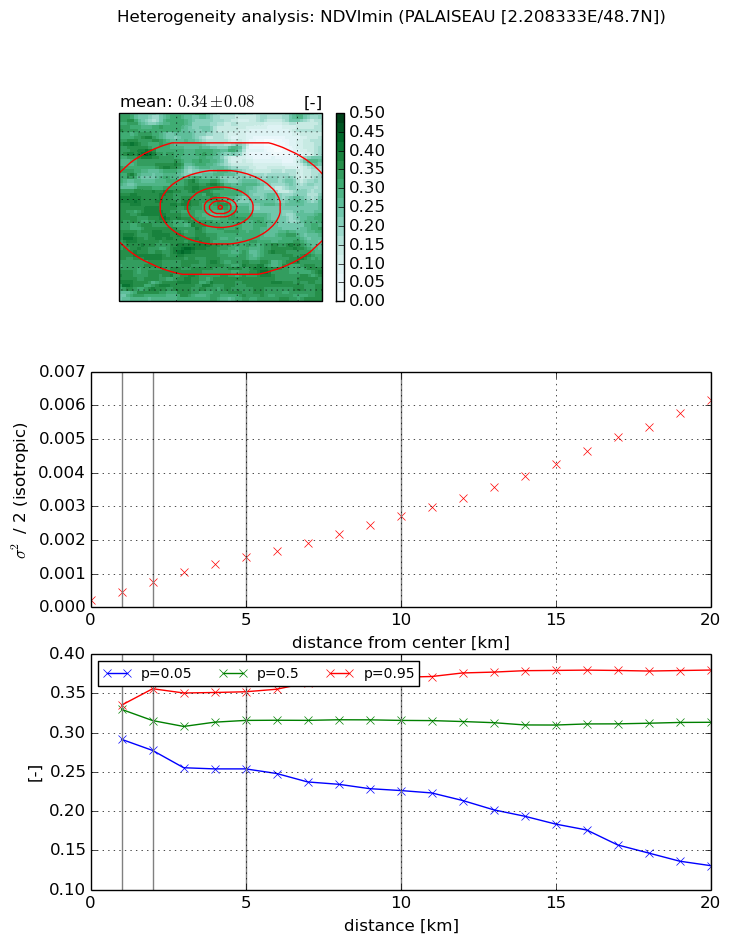
Heterogeneity analysis

The heterogeneity analysis provides information about the spatial and temporal heterogeneity of the site.

Topography


Roman et al. (2009) index


St

3.23179079828

Rcv

0.0163935983035

Rse

0.0

Rst

-0.0938096986659

Rsv

0.818074610623


Height range @ 1km [m]

102

Height range @ 2km [m]

102

Height range @ 5km [m]

100

Height range @ 10km [m]

-999

Height range @ 20km [m]

-999


Variance slope @ 1 km

561

Variance slope @ 2 km

506

Variance slope @ 5 km

273

Variance slope @ 10 km

-999

Variance slope @ 20 km

-999


NDVI (max. NDVI composite)


Roman et al. (2009) index


St

6.73420976848

Rcv

0.347854550592

Rse

0.0

Rst

-0.0177954314926

Rsv

0.0798365862194


NDVI range @ 1km [-]

0.02

NDVI range @ 2km [-]

0.07

NDVI range @ 5km [-]

0.14

NDVI range @ 10km [-]

0.24

NDVI range @ 20km [-]

0.38


Variance slope @ 1 km

0.000605966346089

Variance slope @ 2 km

0.000708946654161

Variance slope @ 5 km

0.000714316756658

Variance slope @ 10 km

0.000641073170089

Variance slope @ 20 km

0.000694827250041


NDVI (min. NDVI composite)I


Roman et al. (2009) index


St

2.58059086159

Rcv

0.128757977155

Rse

0.0

Rst

-0.19910741828

Rsv

0.834659065396


NDVI range @ 1km [-]

0.04

NDVI range @ 2km [-]

0.08

NDVI range @ 5km [-]

0.1

NDVI range @ 10km [-]

0.14

NDVI range @ 20km [-]

0.25


NDVI slope @ 1 km

0.000238787278926

NDVI slope @ 2 km

0.000273173876803

NDVI slope @ 5 km

0.000264152017778

NDVI slope @ 10 km

0.000244743899582

NDVI slope @ 20 km

0.000289552275013


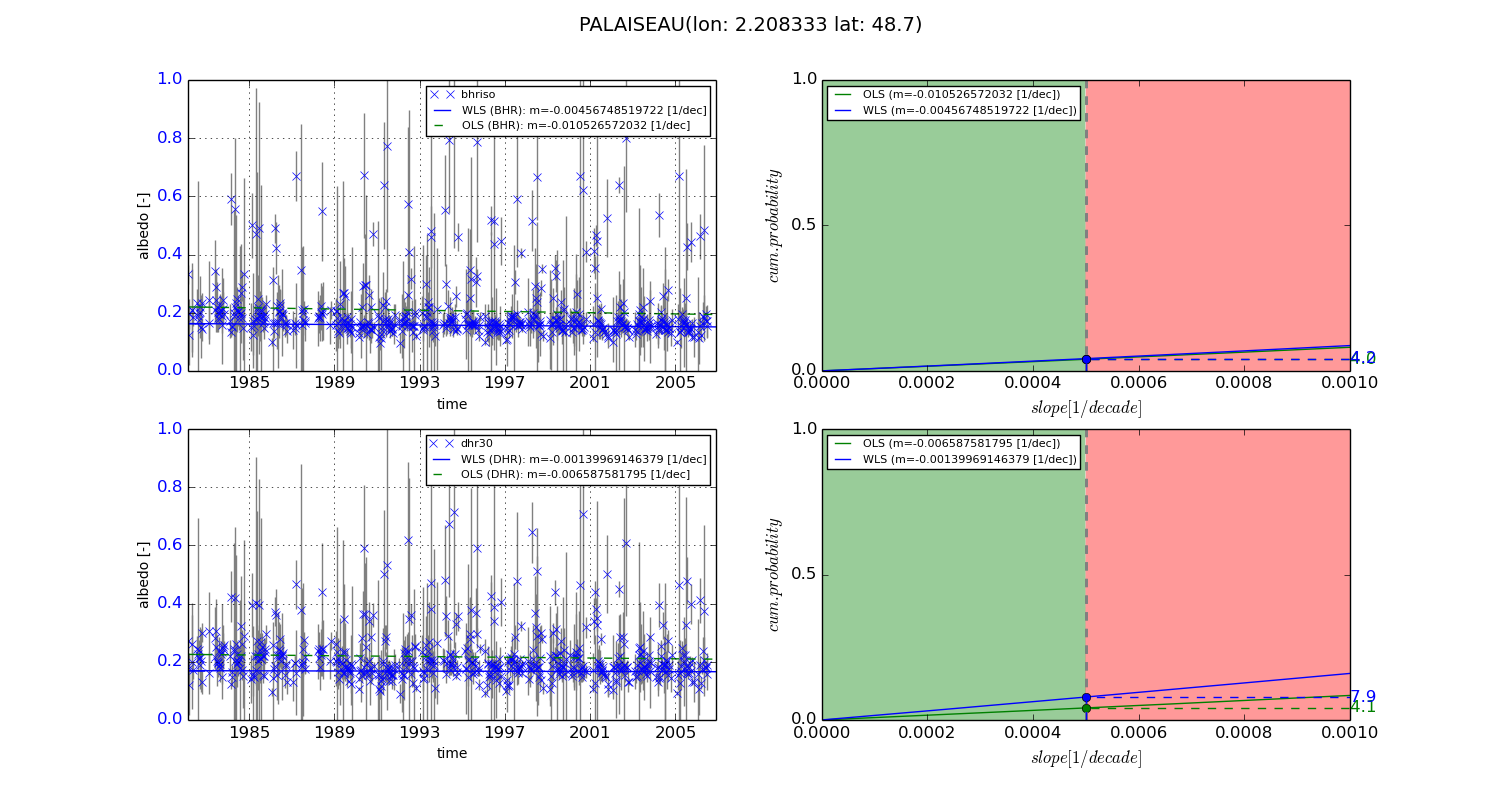
Temporal stability analysis

+000 deg (BHR)


BHR statistics

Temporal stability [1/decade]:


abs

rel


Weighted least square:

-0.00456748519722


Ordinary least square:

-0.010526572032


Probabilities that GCOS criteria is met:

Weighted least square:

4.2 %

Ordinary least square:

4.0 %


DHR statistics

Temporal stability [1/decade]:


abs

rel


Weighted least square:

-0.00139969146379


Ordinary least square:

-0.006587581795


Probabilities that GCOS criteria is met:

Weighted least square:

7.9 %

Ordinary least square:

4.1 %


+057/+063 deg (BHR)


BHR statistics

Temporal stability [1/decade]:


abs

rel


Weighted least square:

-99999.0


Ordinary least square:

-99999.0


Probabilities that GCOS criteria is met:

Weighted least square:

-99999.0 %

Ordinary least square:

-99999.0 %


DHR statistics

Temporal stability [1/decade]:


abs

rel


Weighted least square:

-99999.0


Ordinary least square:

-99999.0


Probabilities that GCOS criteria is met:

Weighted least square:

-99999.0 %

Ordinary least square:

-99999.0 %


Temporal anomaly analyis

The variance of the temporal anomalies provides an additional measure about the stability of the signal AFTER removal of the mean seasonal cylce.
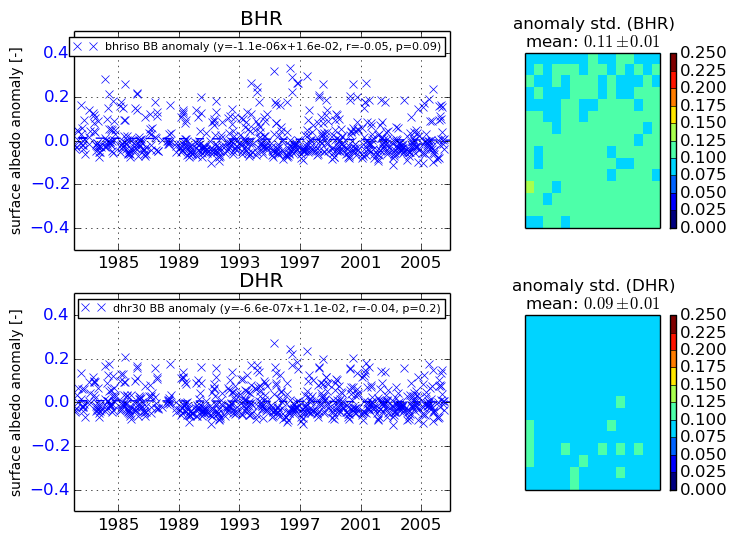
+000 deg


+057/+063 deg