PALENCIA


Location

lon / lat [deg]: -4.5157 / 41.9886

Source network: AERONET


Geostationary surface albedo (GSA) data


“+000”


“+057/+063”


Landcover information (based on ESA CCI landcover data)


Landcover fractions @ 2km distance


Landcover fractions @ 20 km distance


Legend


Distance to open water bodies [km]:

7.65

Distance to urban areas [km]:

0.12


Radius: 1 km

Number of landcover classes:

3

Dominant landcover type:

190: urban areas

Fraction of dominant landcover type [%]:

70.0


Radius: 2 km

Number of landcover classes:

3

Dominant landcover type:

190: urban areas

Fraction of dominant landcover type [%]:

57.0


Radius: 5 km

Number of landcover classes:

5

Dominant landcover type:

10: cropland, rainfed

Fraction of dominant landcover type [%]:

46.0


Radius: 10 km

Number of landcover classes:

5

Dominant landcover type:

10: cropland, rainfed

Fraction of dominant landcover type [%]:

59.0


Radius: 20 km

Number of landcover classes:

5

Dominant landcover type:

10: cropland, rainfed

Fraction of dominant landcover type [%]:

69.0


Disturbances


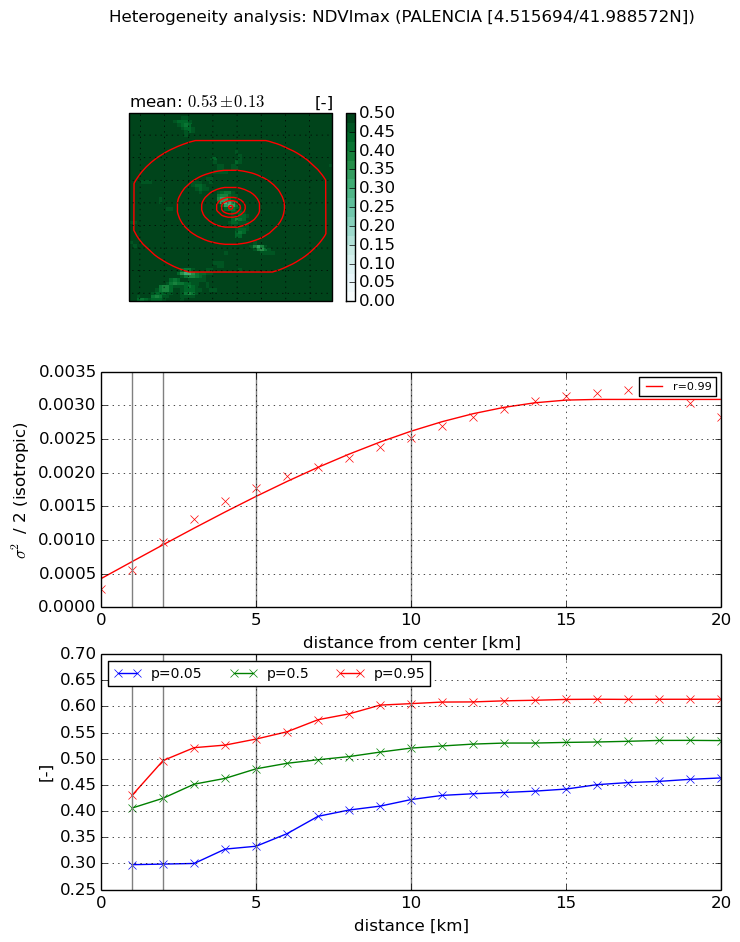
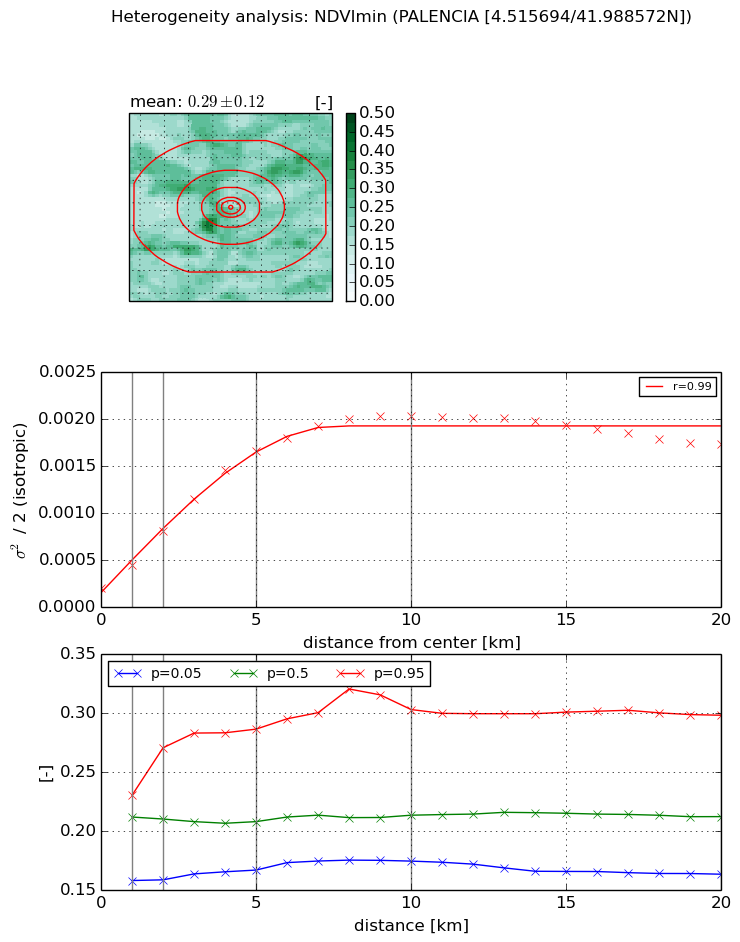
Heterogeneity analysis

The heterogeneity analysis provides information about the spatial and temporal heterogeneity of the site.

Topography


Roman et al. (2009) index


St

5.22784631224

Rcv

0.255337694916

Rse

0.0

Rst

-0.000437953879887

Rsv

0.318074426516


Height range @ 1km [m]

25

Height range @ 2km [m]

84

Height range @ 5km [m]

146

Height range @ 10km [m]

-999

Height range @ 20km [m]

-999


Variance slope @ 1 km

555

Variance slope @ 2 km

692

Variance slope @ 5 km

753

Variance slope @ 10 km

-999

Variance slope @ 20 km

-999


NDVI (max. NDVI composite)


Roman et al. (2009) index


St

4.6030596534

Rcv

-0.143144638282

Rse

0.0

Rst

-0.120287194505

Rsv

0.388308580306


NDVI range @ 1km [-]

0.13

NDVI range @ 2km [-]

0.2

NDVI range @ 5km [-]

0.2

NDVI range @ 10km [-]

0.18

NDVI range @ 20km [-]

0.15


Variance slope @ 1 km

0.000294774583451

Variance slope @ 2 km

0.000349058411329

Variance slope @ 5 km

0.000312786179996

Variance slope @ 10 km

0.000220289176205

Variance slope @ 20 km

0.000135419745708


NDVI (min. NDVI composite)I


Roman et al. (2009) index


St

2.1164408504

Rcv

0.0670691638076

Rse

0.0

Rst

-0.21543181767

Rsv

1.13497307617


NDVI range @ 1km [-]

0.07

NDVI range @ 2km [-]

0.11

NDVI range @ 5km [-]

0.12

NDVI range @ 10km [-]

0.13

NDVI range @ 20km [-]

0.14


NDVI slope @ 1 km

0.000244995552466

NDVI slope @ 2 km

0.000304091279424

NDVI slope @ 5 km

0.000303568627488

NDVI slope @ 10 km

0.00019023680696

NDVI slope @ 20 km

5.79967956629e-05


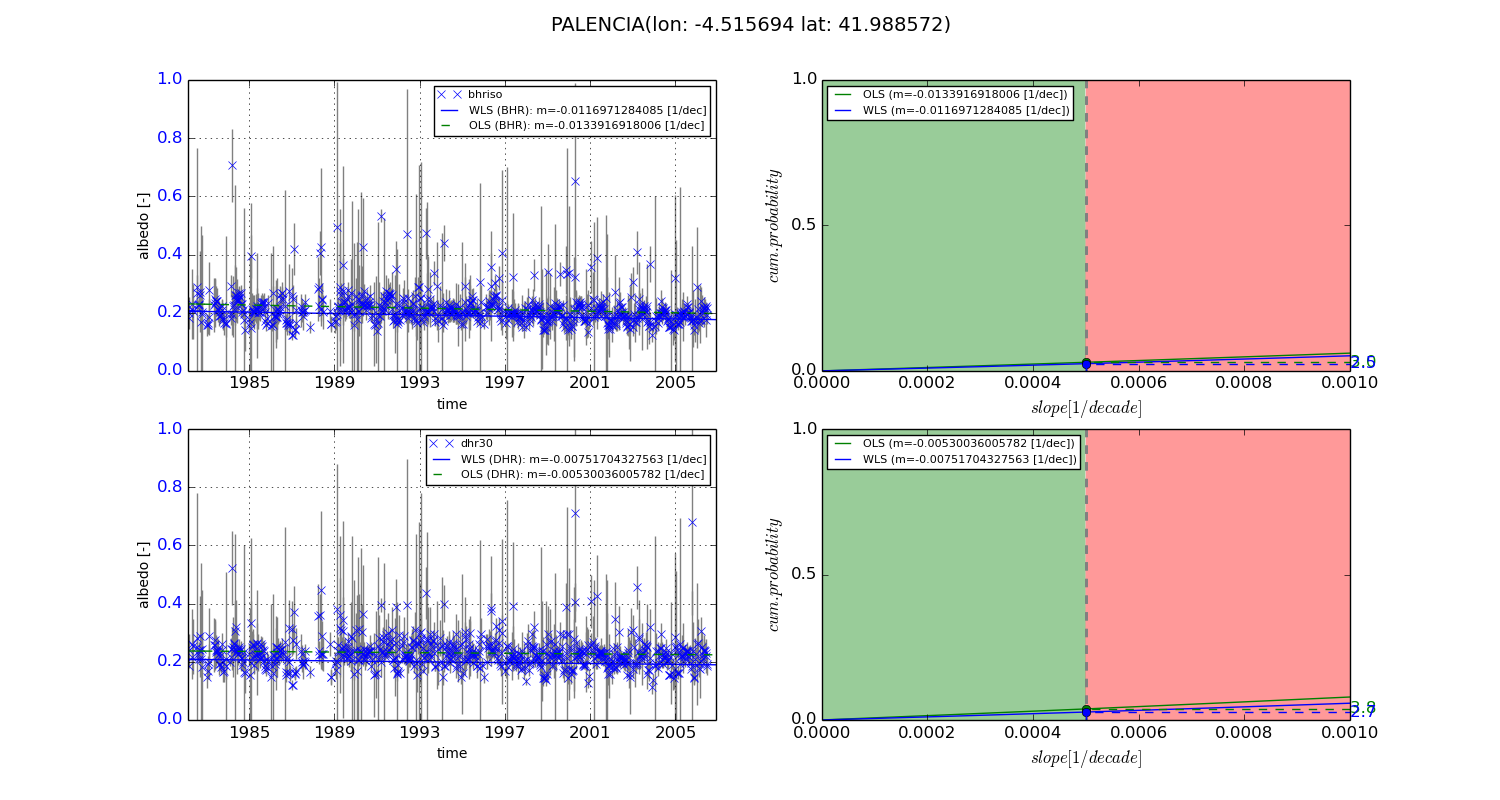
Temporal stability analysis

+000 deg (BHR)


BHR statistics

Temporal stability [1/decade]:


abs

rel


Weighted least square:

-0.0116971284085


Ordinary least square:

-0.0133916918006


Probabilities that GCOS criteria is met:

Weighted least square:

2.5 %

Ordinary least square:

3.0 %


DHR statistics

Temporal stability [1/decade]:


abs

rel


Weighted least square:

-0.00751704327563


Ordinary least square:

-0.00530036005782


Probabilities that GCOS criteria is met:

Weighted least square:

2.7 %

Ordinary least square:

3.8 %


+057/+063 deg (BHR)


BHR statistics

Temporal stability [1/decade]:


abs

rel


Weighted least square:

-99999.0


Ordinary least square:

-99999.0


Probabilities that GCOS criteria is met:

Weighted least square:

-99999.0 %

Ordinary least square:

-99999.0 %


DHR statistics

Temporal stability [1/decade]:


abs

rel


Weighted least square:

-99999.0


Ordinary least square:

-99999.0


Probabilities that GCOS criteria is met:

Weighted least square:

-99999.0 %

Ordinary least square:

-99999.0 %


Temporal anomaly analyis

The variance of the temporal anomalies provides an additional measure about the stability of the signal AFTER removal of the mean seasonal cylce.
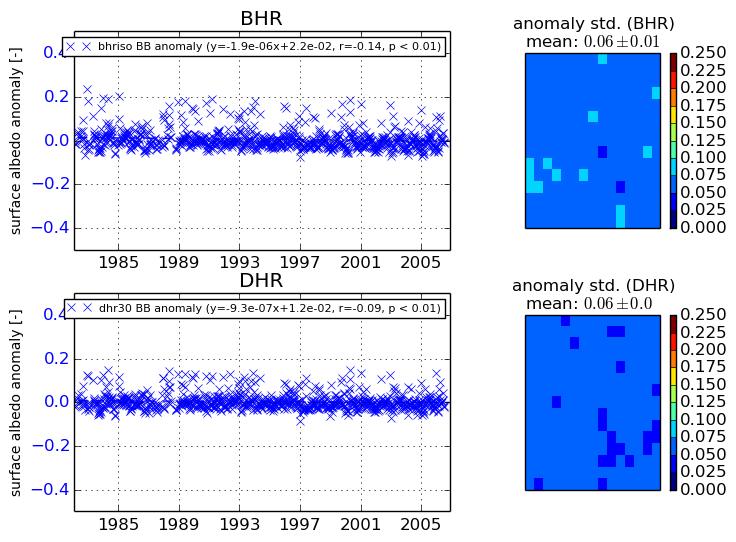
+000 deg


+057/+063 deg