PANTANAL


Location

lon / lat [deg]: -56.6218 / -16.3955

Source network: AERONET


Geostationary surface albedo (GSA) data


“+000”


“+057/+063”


Landcover information (based on ESA CCI landcover data)


Landcover fractions @ 2km distance


Landcover fractions @ 20 km distance


Legend


Distance to open water bodies [km]:

0.19

Distance to urban areas [km]:

12.36


Radius: 1 km

Number of landcover classes:

4

Dominant landcover type:

50: Tree cover, broadleaved, evergreen, closed to open (>15%)

Fraction of dominant landcover type [%]:

66.0


Radius: 2 km

Number of landcover classes:

8

Dominant landcover type:

50: Tree cover, broadleaved, evergreen, closed to open (>15%)

Fraction of dominant landcover type [%]:

72.0


Radius: 5 km

Number of landcover classes:

7

Dominant landcover type:

50: Tree cover, broadleaved, evergreen, closed to open (>15%)

Fraction of dominant landcover type [%]:

38.0


Radius: 10 km

Number of landcover classes:

8

Dominant landcover type:

50: Tree cover, broadleaved, evergreen, closed to open (>15%)

Fraction of dominant landcover type [%]:

37.0


Radius: 20 km

Number of landcover classes:

9

Dominant landcover type:

50: Tree cover, broadleaved, evergreen, closed to open (>15%)

Fraction of dominant landcover type [%]:

37.0


Disturbances


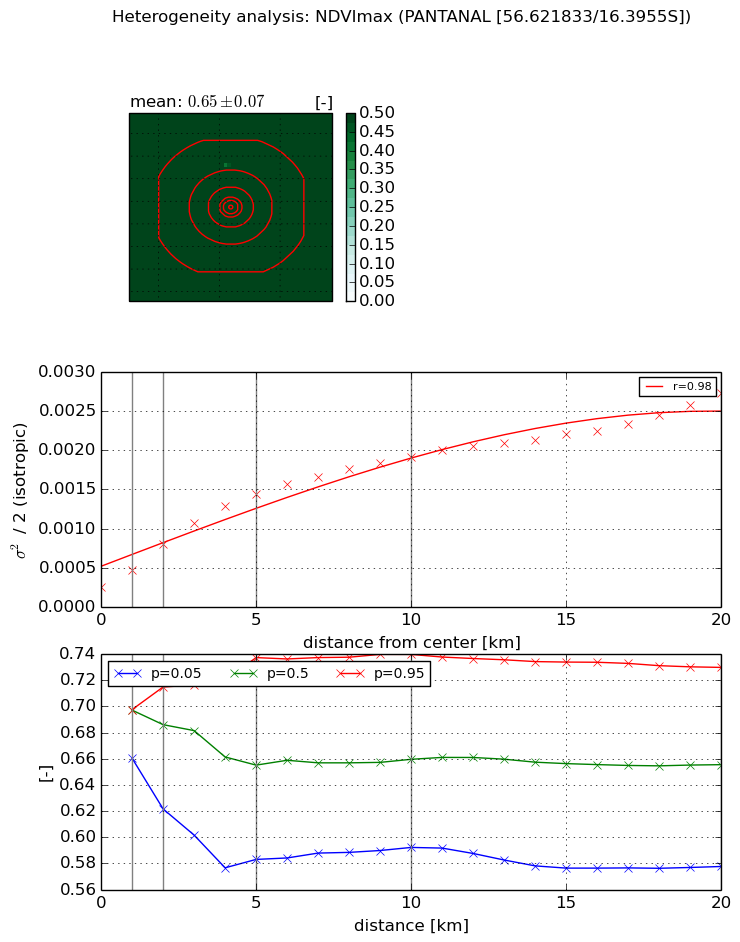
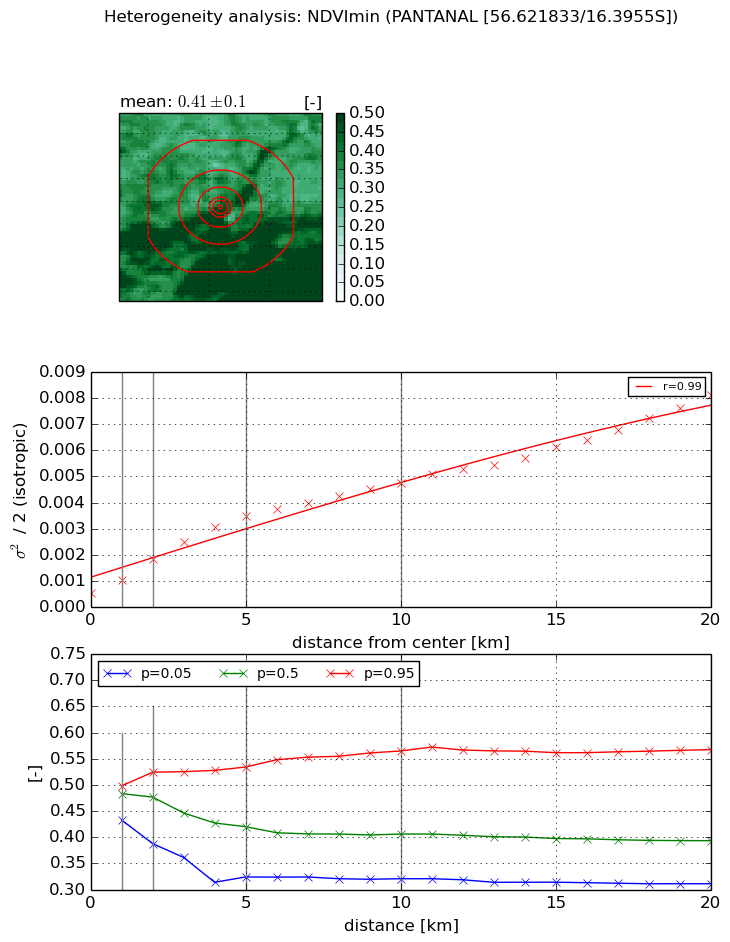
Heterogeneity analysis

The heterogeneity analysis provides information about the spatial and temporal heterogeneity of the site.

Topography


Roman et al. (2009) index


St

5.0243292951

Rcv

0.0541323529526

Rse

0.0

Rst

0.123011930448

Rsv

-0.419950338349


Height range @ 1km [m]

8

Height range @ 2km [m]

8

Height range @ 5km [m]

8

Height range @ 10km [m]

-999

Height range @ 20km [m]

-999


Variance slope @ 1 km

5

Variance slope @ 2 km

3

Variance slope @ 5 km

0

Variance slope @ 10 km

-999

Variance slope @ 20 km

-999


NDVI (max. NDVI composite)


Roman et al. (2009) index


St

4.71988531119

Rcv

0.310234541379

Rse

0.0

Rst

-0.0706272880997

Rsv

0.254746835183


NDVI range @ 1km [-]

0.04

NDVI range @ 2km [-]

0.09

NDVI range @ 5km [-]

0.15

NDVI range @ 10km [-]

0.15

NDVI range @ 20km [-]

0.15


Variance slope @ 1 km

0.00021225507756

Variance slope @ 2 km

0.00027088706271

Variance slope @ 5 km

0.000247348134999

Variance slope @ 10 km

0.000164551095414

Variance slope @ 20 km

0.000103444200336


NDVI (min. NDVI composite)I


Roman et al. (2009) index


St

3.24162757785

Rcv

0.500094860049

Rse

0.0

Rst

-0.142596959984

Rsv

0.28276921087


NDVI range @ 1km [-]

0.07

NDVI range @ 2km [-]

0.14

NDVI range @ 5km [-]

0.21

NDVI range @ 10km [-]

0.24

NDVI range @ 20km [-]

0.26


NDVI slope @ 1 km

0.000486150747139

NDVI slope @ 2 km

0.000640641822551

NDVI slope @ 5 km

0.000614355492718

NDVI slope @ 10 km

0.000418237938419

NDVI slope @ 20 km

0.000332705787678


Temporal stability analysis

+000 deg (BHR)


BHR statistics

Temporal stability [1/decade]:


abs

rel


Weighted least square:

-99999.0


Ordinary least square:

-99999.0


Probabilities that GCOS criteria is met:

Weighted least square:

-99999.0 %

Ordinary least square:

-99999.0 %


DHR statistics

Temporal stability [1/decade]:


abs

rel


Weighted least square:

-99999.0


Ordinary least square:

-99999.0


Probabilities that GCOS criteria is met:

Weighted least square:

-99999.0 %

Ordinary least square:

-99999.0 %


+057/+063 deg (BHR)


BHR statistics

Temporal stability [1/decade]:


abs

rel


Weighted least square:

None


Ordinary least square:

None


Probabilities that GCOS criteria is met:

Weighted least square:

None %

Ordinary least square:

None %


DHR statistics

Temporal stability [1/decade]:


abs

rel


Weighted least square:

None


Ordinary least square:

None


Probabilities that GCOS criteria is met:

Weighted least square:

None %

Ordinary least square:

None %


Temporal anomaly analyis

The variance of the temporal anomalies provides an additional measure about the stability of the signal AFTER removal of the mean seasonal cylce.

+000 deg


+057/+063 deg