PANTNAGAR


Location

lon / lat [deg]: 79.5209 / 29.0463

Source network: AERONET


Geostationary surface albedo (GSA) data


“+000”


“+057/+063”


Landcover information (based on ESA CCI landcover data)


Landcover fractions @ 2km distance


Landcover fractions @ 20 km distance


Legend


Distance to open water bodies [km]:

10.4

Distance to urban areas [km]:

1.52


Radius: 1 km

Number of landcover classes:

1

Dominant landcover type:

20: cropland, irrigated or post-flooded

Fraction of dominant landcover type [%]:

100.0


Radius: 2 km

Number of landcover classes:

4

Dominant landcover type:

20: cropland, irrigated or post-flooded

Fraction of dominant landcover type [%]:

94.0


Radius: 5 km

Number of landcover classes:

7

Dominant landcover type:

20: cropland, irrigated or post-flooded

Fraction of dominant landcover type [%]:

70.0


Radius: 10 km

Number of landcover classes:

11

Dominant landcover type:

20: cropland, irrigated or post-flooded

Fraction of dominant landcover type [%]:

61.0


Radius: 20 km

Number of landcover classes:

12

Dominant landcover type:

20: cropland, irrigated or post-flooded

Fraction of dominant landcover type [%]:

63.0


Disturbances


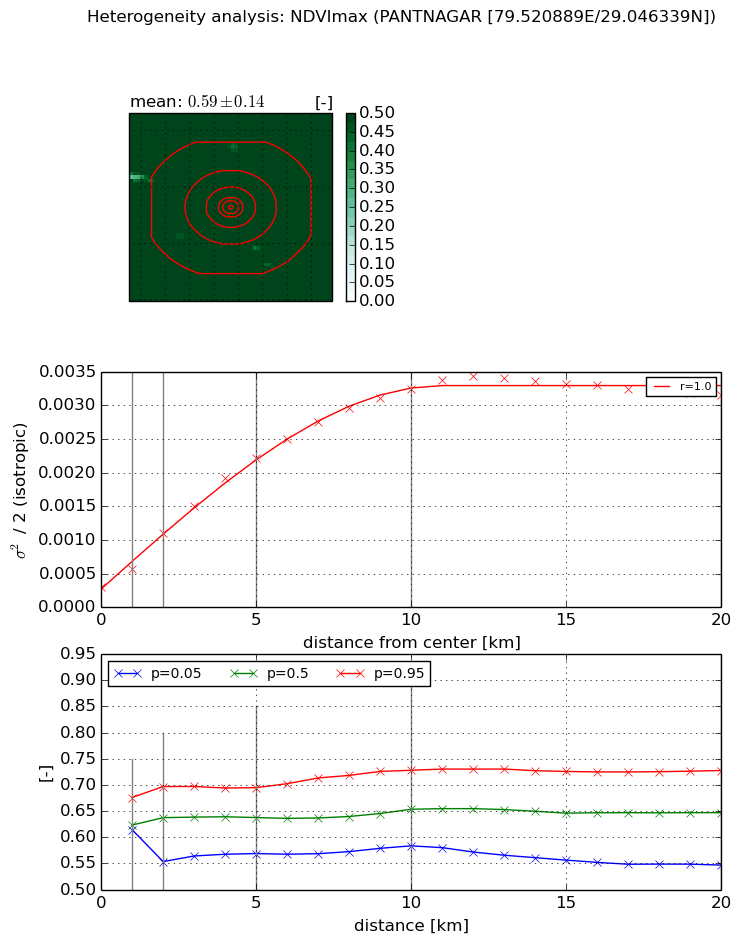
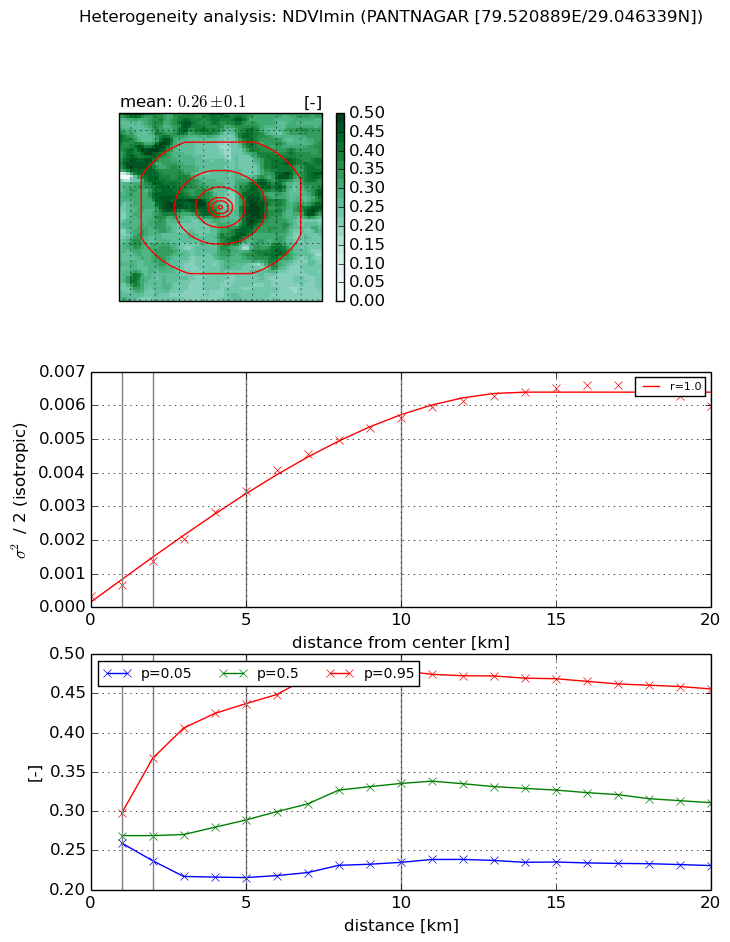
Heterogeneity analysis

The heterogeneity analysis provides information about the spatial and temporal heterogeneity of the site.

Topography


Roman et al. (2009) index


St

1.80247440755

Rcv

0.666985610386

Rse

0.0

Rst

-7.78438878541e-06

Rsv

-0.997385299003


Height range @ 1km [m]

10

Height range @ 2km [m]

19

Height range @ 5km [m]

49

Height range @ 10km [m]

-999

Height range @ 20km [m]

-999


Variance slope @ 1 km

15

Variance slope @ 2 km

22

Variance slope @ 5 km

48

Variance slope @ 10 km

-999

Variance slope @ 20 km

-999


NDVI (max. NDVI composite)


Roman et al. (2009) index


St

3.96667480845

Rcv

0.0197535386951

Rse

0.0

Rst

-0.356923318058

Rsv

0.37962411191


NDVI range @ 1km [-]

0.06

NDVI range @ 2km [-]

0.14

NDVI range @ 5km [-]

0.13

NDVI range @ 10km [-]

0.14

NDVI range @ 20km [-]

0.18


Variance slope @ 1 km

0.000264530616188

Variance slope @ 2 km

0.000399588693447

Variance slope @ 5 km

0.000401219869317

Variance slope @ 10 km

0.000304478770724

Variance slope @ 20 km

0.00013190830054


NDVI (min. NDVI composite)I


Roman et al. (2009) index


St

1.9684099902e-09

Rcv

0.0642258180341

Rse

0.0

Rst

0.375151780795

Rsv

1524072735.9


NDVI range @ 1km [-]

0.04

NDVI range @ 2km [-]

0.13

NDVI range @ 5km [-]

0.22

NDVI range @ 10km [-]

0.24

NDVI range @ 20km [-]

0.23


NDVI slope @ 1 km

0.000323641895289

NDVI slope @ 2 km

0.000518355028706

NDVI slope @ 5 km

0.000654584544093

NDVI slope @ 10 km

0.000567486917172

NDVI slope @ 20 km

0.000306494693106


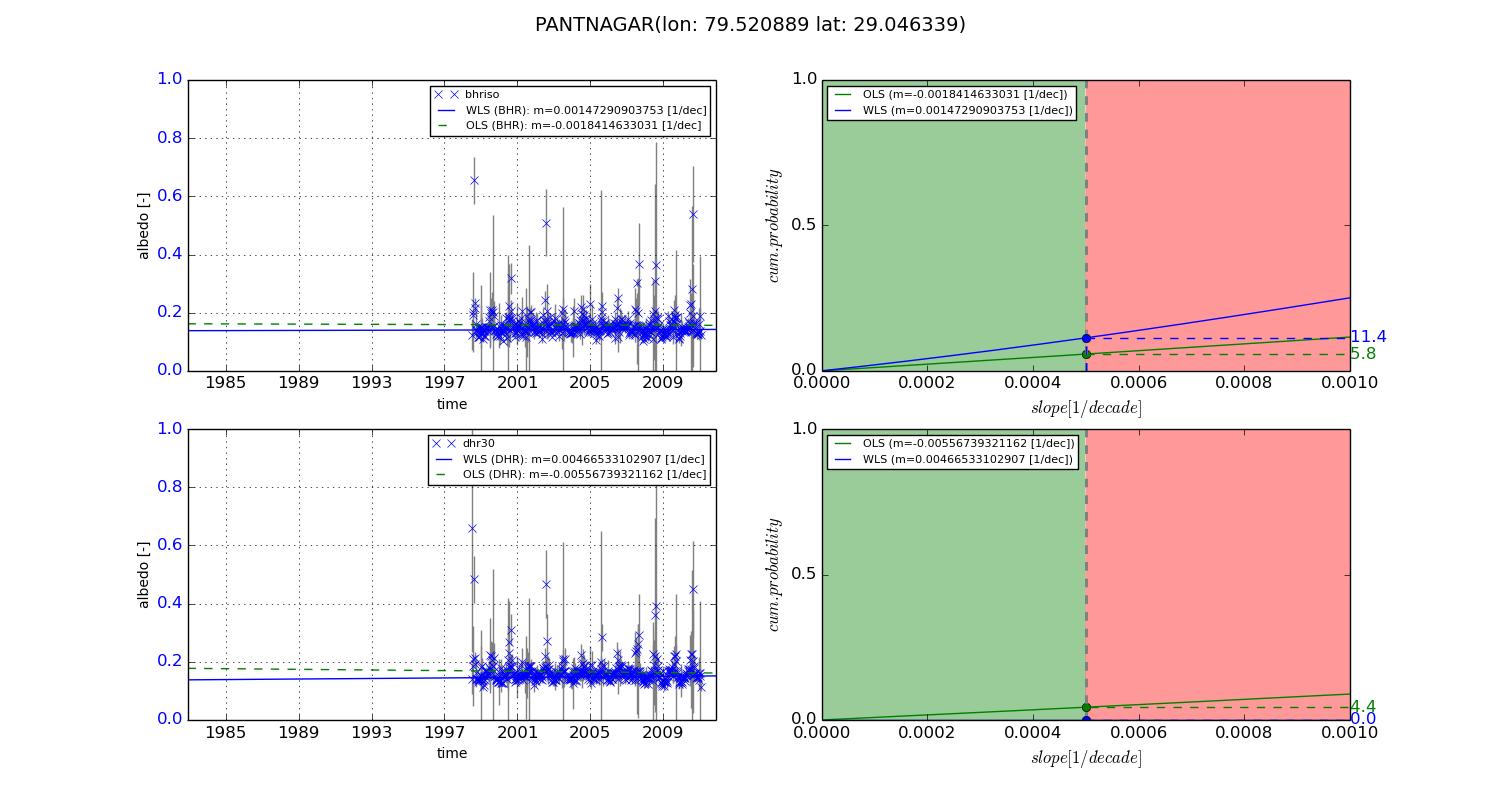
Temporal stability analysis

+000 deg (BHR)


BHR statistics

Temporal stability [1/decade]:


abs

rel


Weighted least square:

-99999.0


Ordinary least square:

-99999.0


Probabilities that GCOS criteria is met:

Weighted least square:

-99999.0 %

Ordinary least square:

-99999.0 %


DHR statistics

Temporal stability [1/decade]:


abs

rel


Weighted least square:

-99999.0


Ordinary least square:

-99999.0


Probabilities that GCOS criteria is met:

Weighted least square:

-99999.0 %

Ordinary least square:

-99999.0 %


+057/+063 deg (BHR)


BHR statistics

Temporal stability [1/decade]:


abs

rel


Weighted least square:

0.00147290903753


Ordinary least square:

-0.0018414633031


Probabilities that GCOS criteria is met:

Weighted least square:

11.4 %

Ordinary least square:

5.8 %


DHR statistics

Temporal stability [1/decade]:


abs

rel


Weighted least square:

0.00466533102907


Ordinary least square:

-0.00556739321162


Probabilities that GCOS criteria is met:

Weighted least square:

0.0 %

Ordinary least square:

4.4 %


Temporal anomaly analyis

The variance of the temporal anomalies provides an additional measure about the stability of the signal AFTER removal of the mean seasonal cylce.

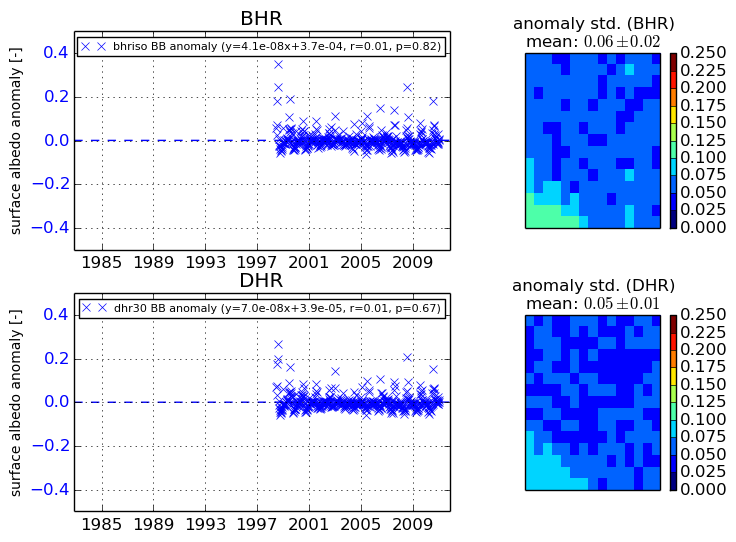
+000 deg


+057/+063 deg