PARIS


Location

lon / lat [deg]: 2.3333 / 48.8667

Source network: AERONET


Geostationary surface albedo (GSA) data


“+000”


“+057/+063”


Landcover information (based on ESA CCI landcover data)


Landcover fractions @ 2km distance


Landcover fractions @ 20 km distance


Legend


Distance to open water bodies [km]:

3.83

Distance to urban areas [km]:

0.18


Radius: 1 km

Number of landcover classes:

1

Dominant landcover type:

190: urban areas

Fraction of dominant landcover type [%]:

100.0


Radius: 2 km

Number of landcover classes:

1

Dominant landcover type:

190: urban areas

Fraction of dominant landcover type [%]:

100.0


Radius: 5 km

Number of landcover classes:

1

Dominant landcover type:

190: urban areas

Fraction of dominant landcover type [%]:

100.0


Radius: 10 km

Number of landcover classes:

1

Dominant landcover type:

190: urban areas

Fraction of dominant landcover type [%]:

100.0


Radius: 20 km

Number of landcover classes:

3

Dominant landcover type:

190: urban areas

Fraction of dominant landcover type [%]:

89.0


Disturbances


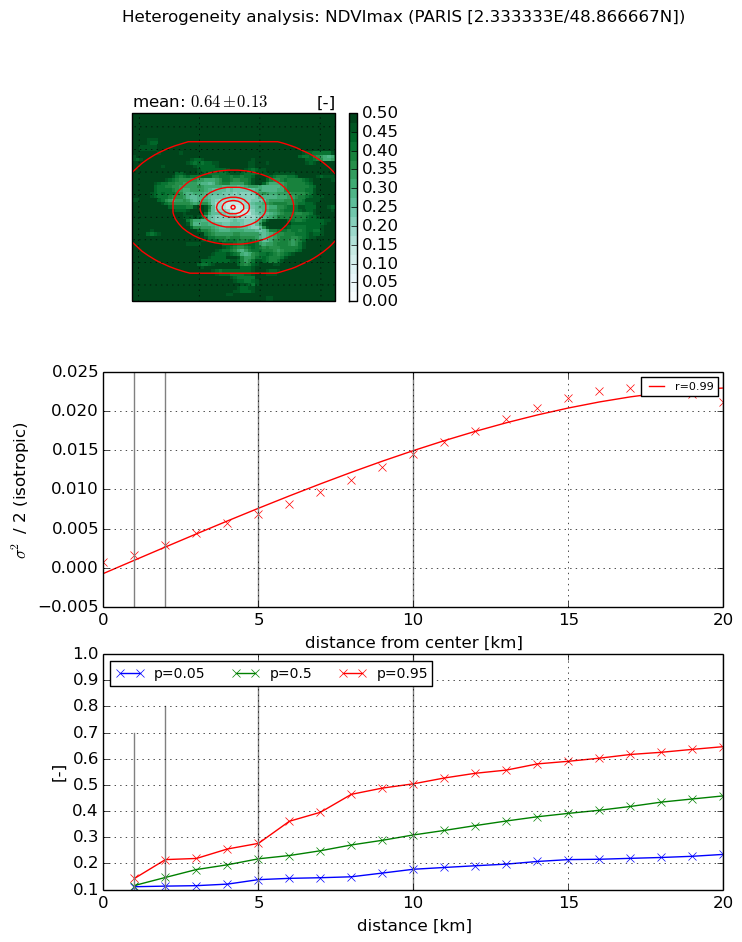
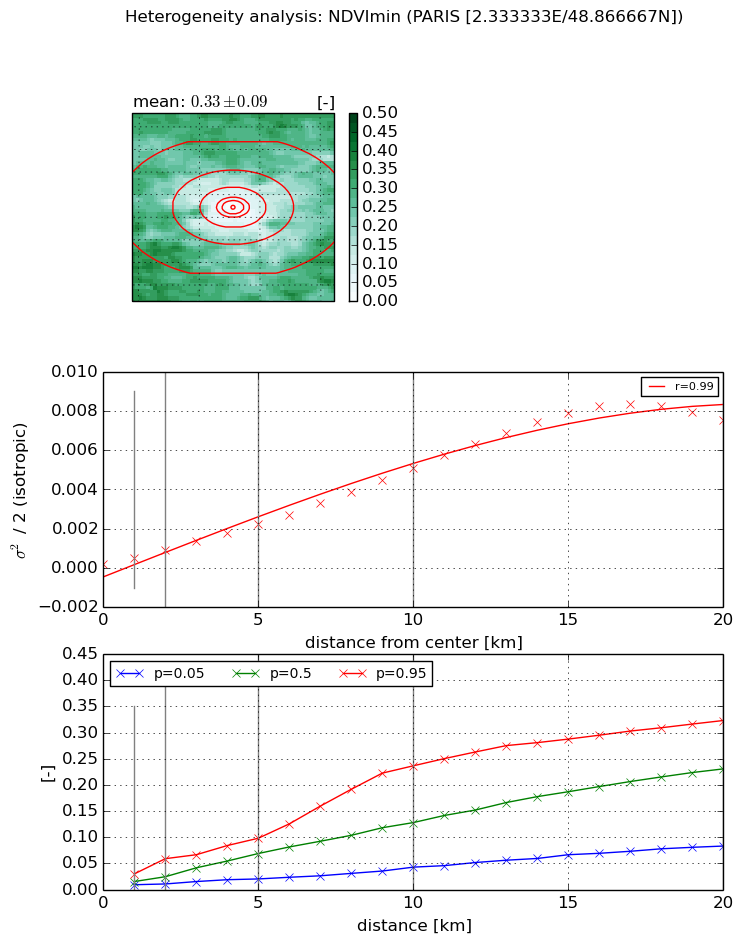
Heterogeneity analysis

The heterogeneity analysis provides information about the spatial and temporal heterogeneity of the site.

Topography


Roman et al. (2009) index


St

5.5999419148

Rcv

0.192273533786

Rse

0.0

Rst

0.0957558481986

Rsv

-0.247690460407


Height range @ 1km [m]

19

Height range @ 2km [m]

31

Height range @ 5km [m]

45

Height range @ 10km [m]

-999

Height range @ 20km [m]

-999


Variance slope @ 1 km

97

Variance slope @ 2 km

106

Variance slope @ 5 km

58

Variance slope @ 10 km

-999

Variance slope @ 20 km

-999


NDVI (max. NDVI composite)


Roman et al. (2009) index


St

4.63279415382

Rcv

0.0624689869426

Rse

0.0

Rst

-0.10147672571

Rsv

0.483611657779


NDVI range @ 1km [-]

0.03

NDVI range @ 2km [-]

0.1

NDVI range @ 5km [-]

0.14

NDVI range @ 10km [-]

0.33

NDVI range @ 20km [-]

0.41


Variance slope @ 1 km

0.000914703993359

Variance slope @ 2 km

0.00111367567875

Variance slope @ 5 km

0.00127967876234

Variance slope @ 10 km

0.00137706207633

Variance slope @ 20 km

0.00122623595541


NDVI (min. NDVI composite)I


Roman et al. (2009) index


St

3.78100085444

Rcv

-0.135674984496

Rse

0.0

Rst

-0.126054979464

Rsv

0.53171074539


NDVI range @ 1km [-]

0.02

NDVI range @ 2km [-]

0.05

NDVI range @ 5km [-]

0.08

NDVI range @ 10km [-]

0.19

NDVI range @ 20km [-]

0.24


NDVI slope @ 1 km

0.000288157197363

NDVI slope @ 2 km

0.00034701367717

NDVI slope @ 5 km

0.00040988047543

NDVI slope @ 10 km

0.000491070987251

NDVI slope @ 20 km

0.000455444666146


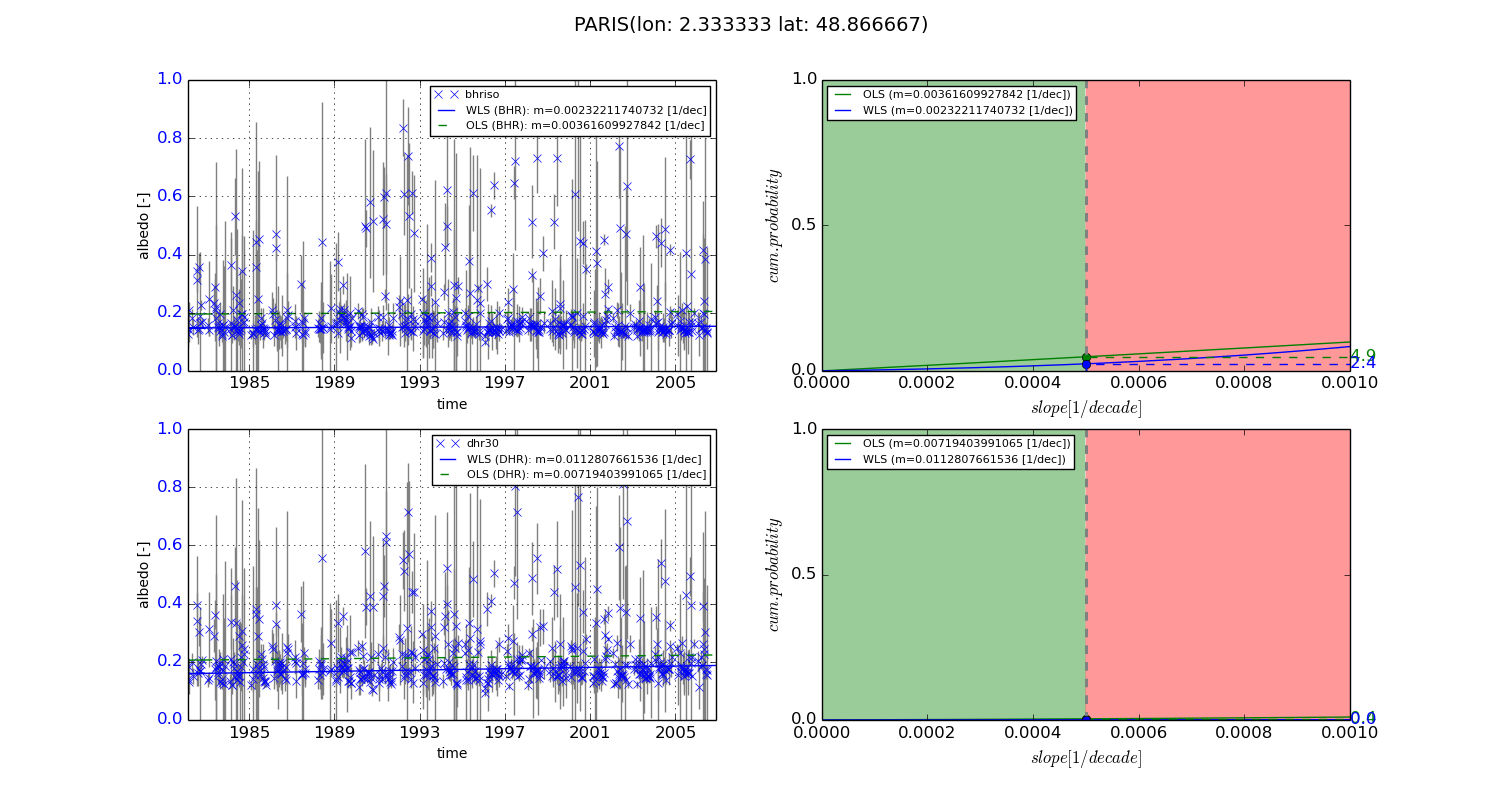
Temporal stability analysis

+000 deg (BHR)


BHR statistics

Temporal stability [1/decade]:


abs

rel


Weighted least square:

0.00232211740732


Ordinary least square:

0.00361609927842


Probabilities that GCOS criteria is met:

Weighted least square:

2.4 %

Ordinary least square:

4.9 %


DHR statistics

Temporal stability [1/decade]:


abs

rel


Weighted least square:

0.0112807661536


Ordinary least square:

0.00719403991065


Probabilities that GCOS criteria is met:

Weighted least square:

0.0 %

Ordinary least square:

0.4 %


+057/+063 deg (BHR)


BHR statistics

Temporal stability [1/decade]:


abs

rel


Weighted least square:

-99999.0


Ordinary least square:

-99999.0


Probabilities that GCOS criteria is met:

Weighted least square:

-99999.0 %

Ordinary least square:

-99999.0 %


DHR statistics

Temporal stability [1/decade]:


abs

rel


Weighted least square:

-99999.0


Ordinary least square:

-99999.0


Probabilities that GCOS criteria is met:

Weighted least square:

-99999.0 %

Ordinary least square:

-99999.0 %


Temporal anomaly analyis

The variance of the temporal anomalies provides an additional measure about the stability of the signal AFTER removal of the mean seasonal cylce.
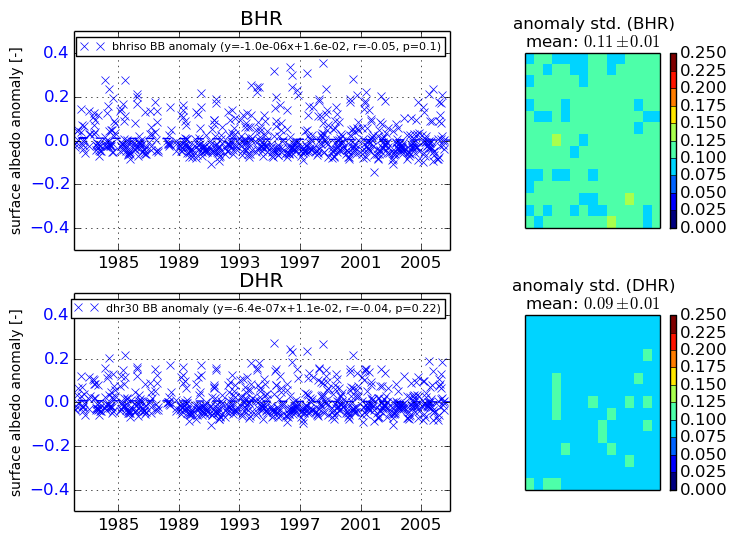
+000 deg


+057/+063 deg